
The Mississippi: Buzzi’s Structural Dominance in American Cement
How thermodynamics, environmental regulation, and geography built an irreplicable logistics advantage that doubles European margins.

Earlier this year I published an investment thesis on Buzzi, an Italian family-controlled cement producer listed on the Milan stock exchange. I argued the company was trading below its real value and that its US operations were stronger than the market realized. If you read that piece, you already know my conclusion and my numbers. This article is not about repeating them.
This article is about something different. A thesis, by design, has to cover a lot of ground quickly: the business model, the financials, the valuation, the risks, the capital allocation history. There is never enough space to go as deep as the subject deserves in any single dimension. The Buzzi thesis was no exception. I spent less time than I wanted on the question that I find most interesting about this company: why does its American business generate the margins it does, and why has no competitor been able to replicate them for decades?
I want to answer that here, but I’m starting with the physical reality of the business instead of the numbers you’ve already seen in my reports. We need to look at what cement actually is and why its economics don’t work like most other industrial products. Once you have that foundation, you’ll see why this specific part of the Midwest is one of the most valuable industrial locations in the country.
You don’t need to have read the thesis to follow this or know anything about cement, about Buzzi, or about equity investing. By the end you should understand exactly how a heavy industrial asset that most people drive past without noticing becomes, in the right location, something close to a permanent economic machine.
Buzzi: a brief orientation before we go further
Buzzi is a cement producer founded in northern Italy in 1907, still controlled by the founding family, and listed in Milan. It operates plants in thirteen countries across Europe, the Americas, and the Middle East. In 2024 it reported net sales of €4.3 billion and EBITDA of €1.28 billion. Those are not small numbers for a company that essentially sells powder.
What makes Buzzi unusual is the structure of its profitability. The United States accounted for 40% of group net sales in 2024 but generated 52% of group EBITDA. That gap between the sales share and the profit share tells you something important: the American business doesn’t just earn more in absolute terms, it earns at a structurally different margin. The EBITDA margin in the US has ranged between 31.3% and 38.4% in every year from 2016 to 2024. The same metric in Germany, a comparable developed market, has ranged from 13.4% to 21.7% over the same period. In Italy, from -18.6% to 24.0%.
The American operation is not temporarily better. It’s structurally better, year after year, through recessions and booms, through low-price and high-price cycles. A gap of that consistency and that magnitude doesn’t come from management skill or from luck. It comes from something embedded in the physical reality of the assets.
That something is the Mississippi River.
Before I explain exactly how, I need to explain one thing about cement that most people don’t know. It’s the single physical fact that makes everything else in this article make sense.
I: About cement
Cement is heavy and remarkably cheap. That combination seems simple. It’s, in practice, the most significant economic factor of any industrial material I’ve analyzed. Here’s why.
A ton of Portland cement leaves the factory gate at roughly $100 to $150 in the US. That’s the price of a product that weighs, by definition, one metric ton. Now look what happens when you move it. Truck transport in the US costs between $0.15 and $0.21 per ton-mile. Move that ton of cement 200 miles to a construction site and you have spent $30 to $42 on freight alone, between 20% and 40% of the product’s entire value, before anyone has earned a cent of margin. Extend the journey to 500 miles and the freight bill approaches or exceeds the factory-gate price of the product itself. The unit economics don’t work anymore.
This is why cement plants are not built where land is cheapest or where engineers are most available. They are built where limestone deposits are, and they sell almost exclusively to customers within 150 to 200 miles, because beyond that radius the delivered cost makes the transaction commercially inviable for everyone.
The impact on the competitive structure is significant. In most industries, a company with a cost advantage or a better product can expand its market geographically, winning customers hundreds or thousands of miles away. In cement, that’s almost impossible without building new plants closer to new demand. The location of your plant determines the market you serve. This reach is limited by trucking costs. Competition is local due to logistics constraints, not strategic decisions.
One way to see the effect of that physical law on prices is to compare cement to materials whose markets are genuinely national or global. Lumber trades on futures exchanges and its price can halve in a year when housing starts collapse. Steel follows the global cycle of Chinese production and American tariffs. Cement does neither. Because every plant is a local monopoly by default, the national price index for cement doesn’t oscillate with macro cycles the way commodity markets do. It drifts upward steadily, passing costs through to customers who have nowhere else to go.
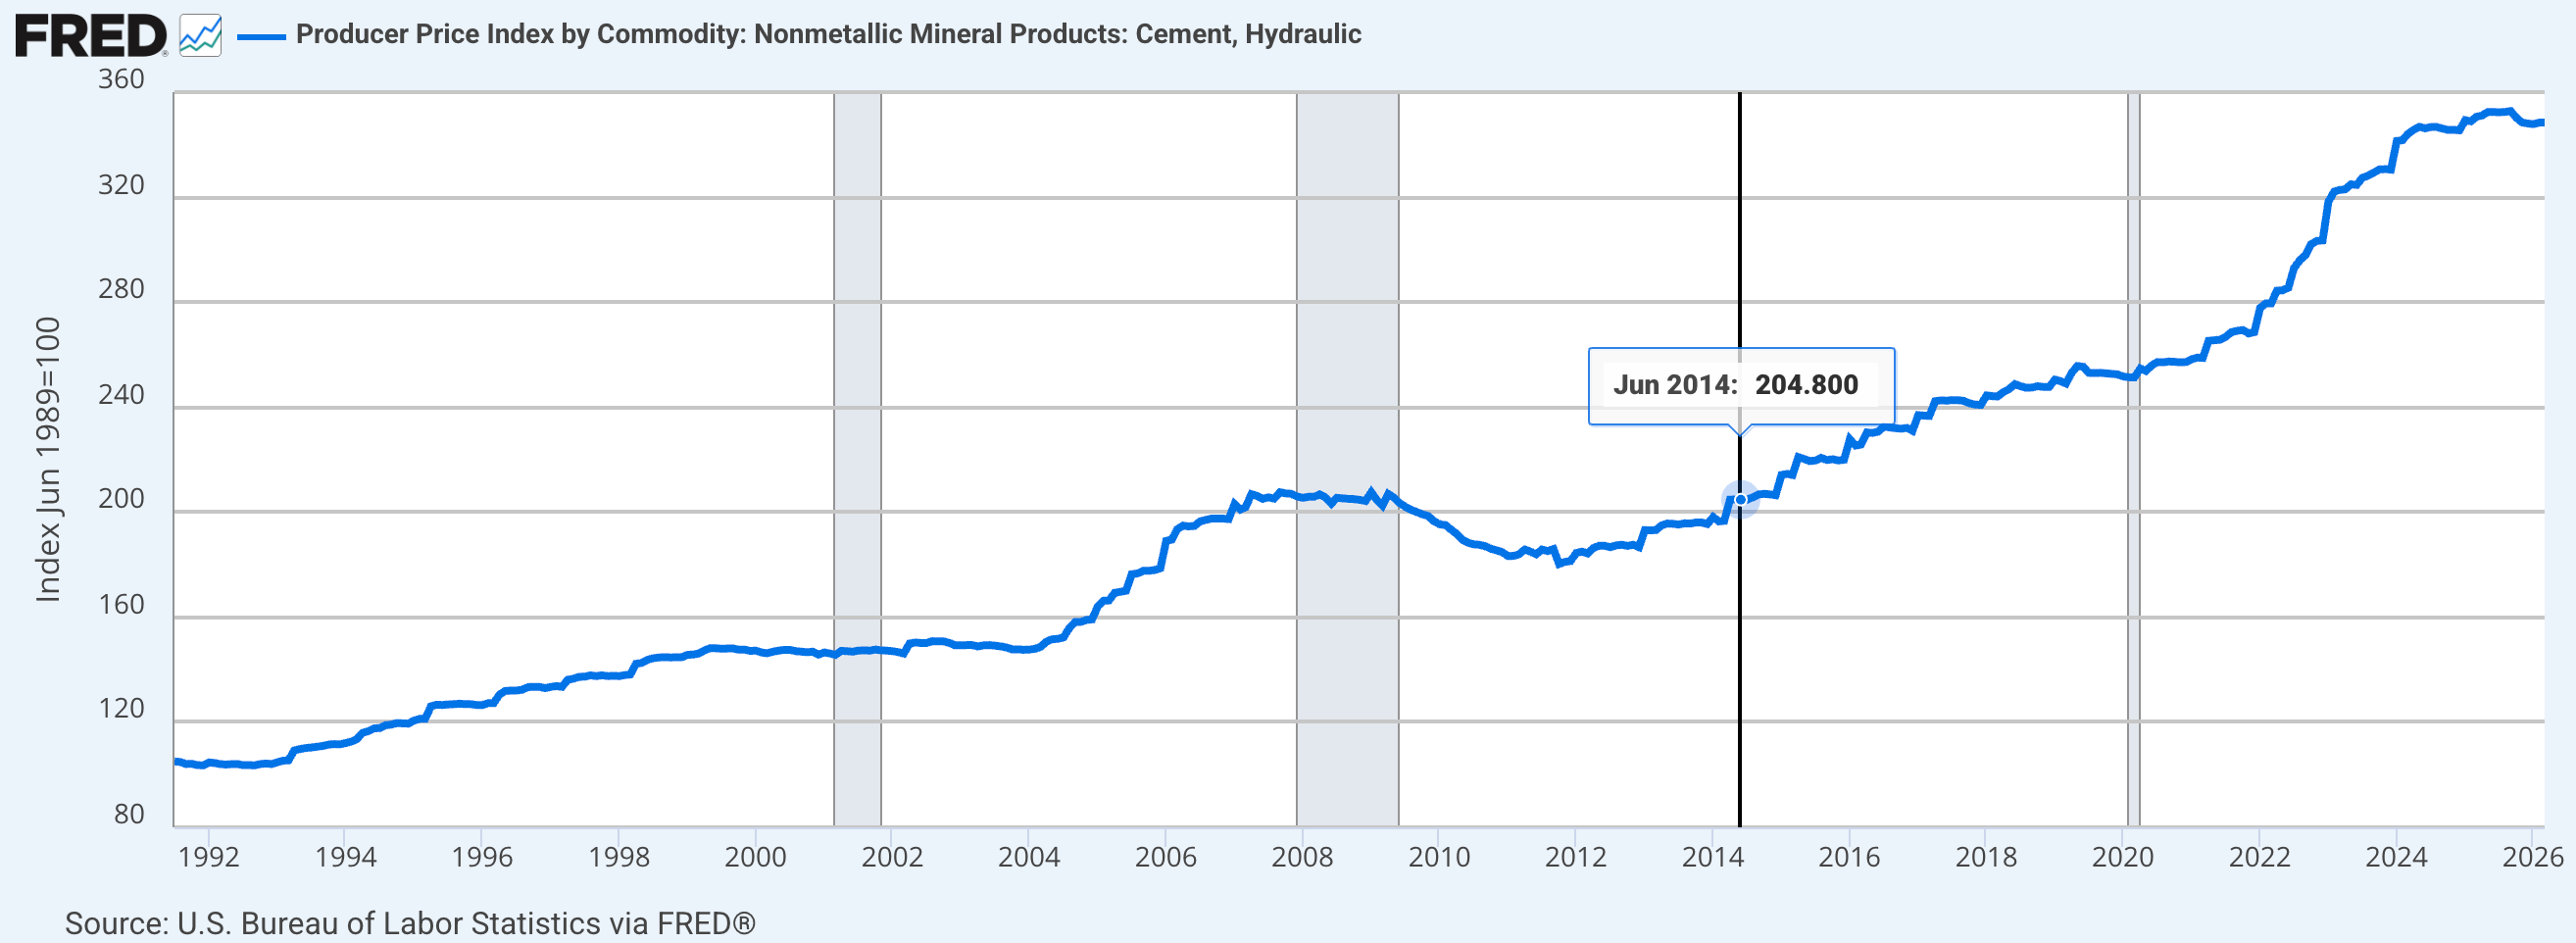
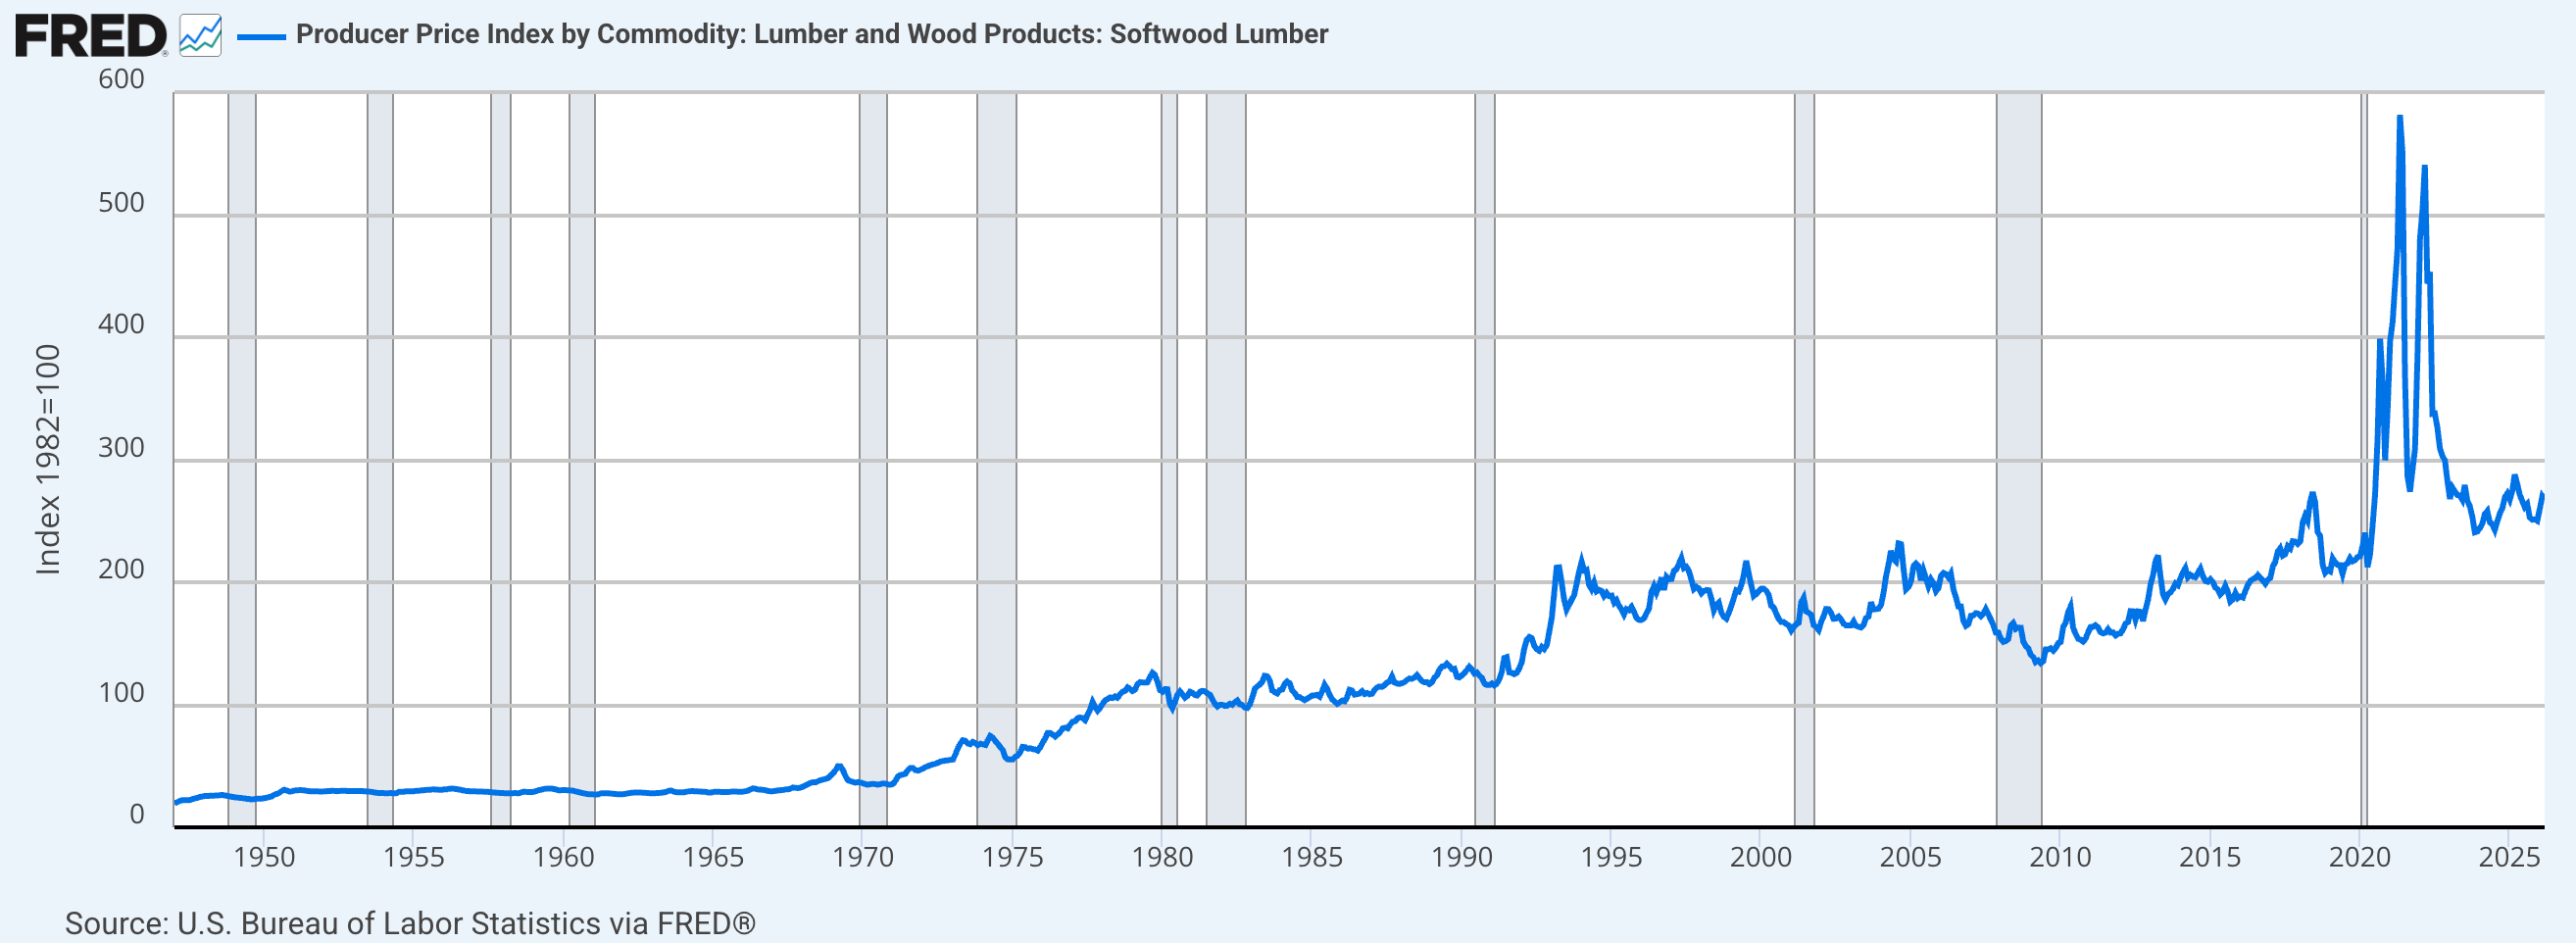
The chart above plots the producer price index for Portland cement alongside the equivalent index for lumber over the past years. The contrast is immediate and instructive. Lumber’s line show high volatility: the pandemic surge that nearly tripled prices between 2020 and 2021, followed by a decline of more than 60% in the two years after. Cement’s line does none of this. It rises slowly and consistently, rarely correcting meaningfully, indifferent to the macro cycles that impact most commodity producers. That’s not a sign of a slow market. It’s the evidence of structural local pricing power, repeated ten thousand times across the country wherever a cement plant is located.
What this means for investors is that the critical analytical question in cement is almost never “is this a good company in the abstract?” It’s “where are this company’s plants, and what does the geography of those specific locations mean for the margins they can structurally earn?”
Most of the time, the situation is standard. A plant is just a plant. The limestone quality is fine, local competitors are rational, and the market stays regional and cyclical. You don’t see any specific advantage coming from the geography.
But sometimes, a plant’s location changes the standard logistics model. It’s a spot where the 150-mile limit doesn't apply. The unit economics aren't driven by trucking, but by something different: water transport.
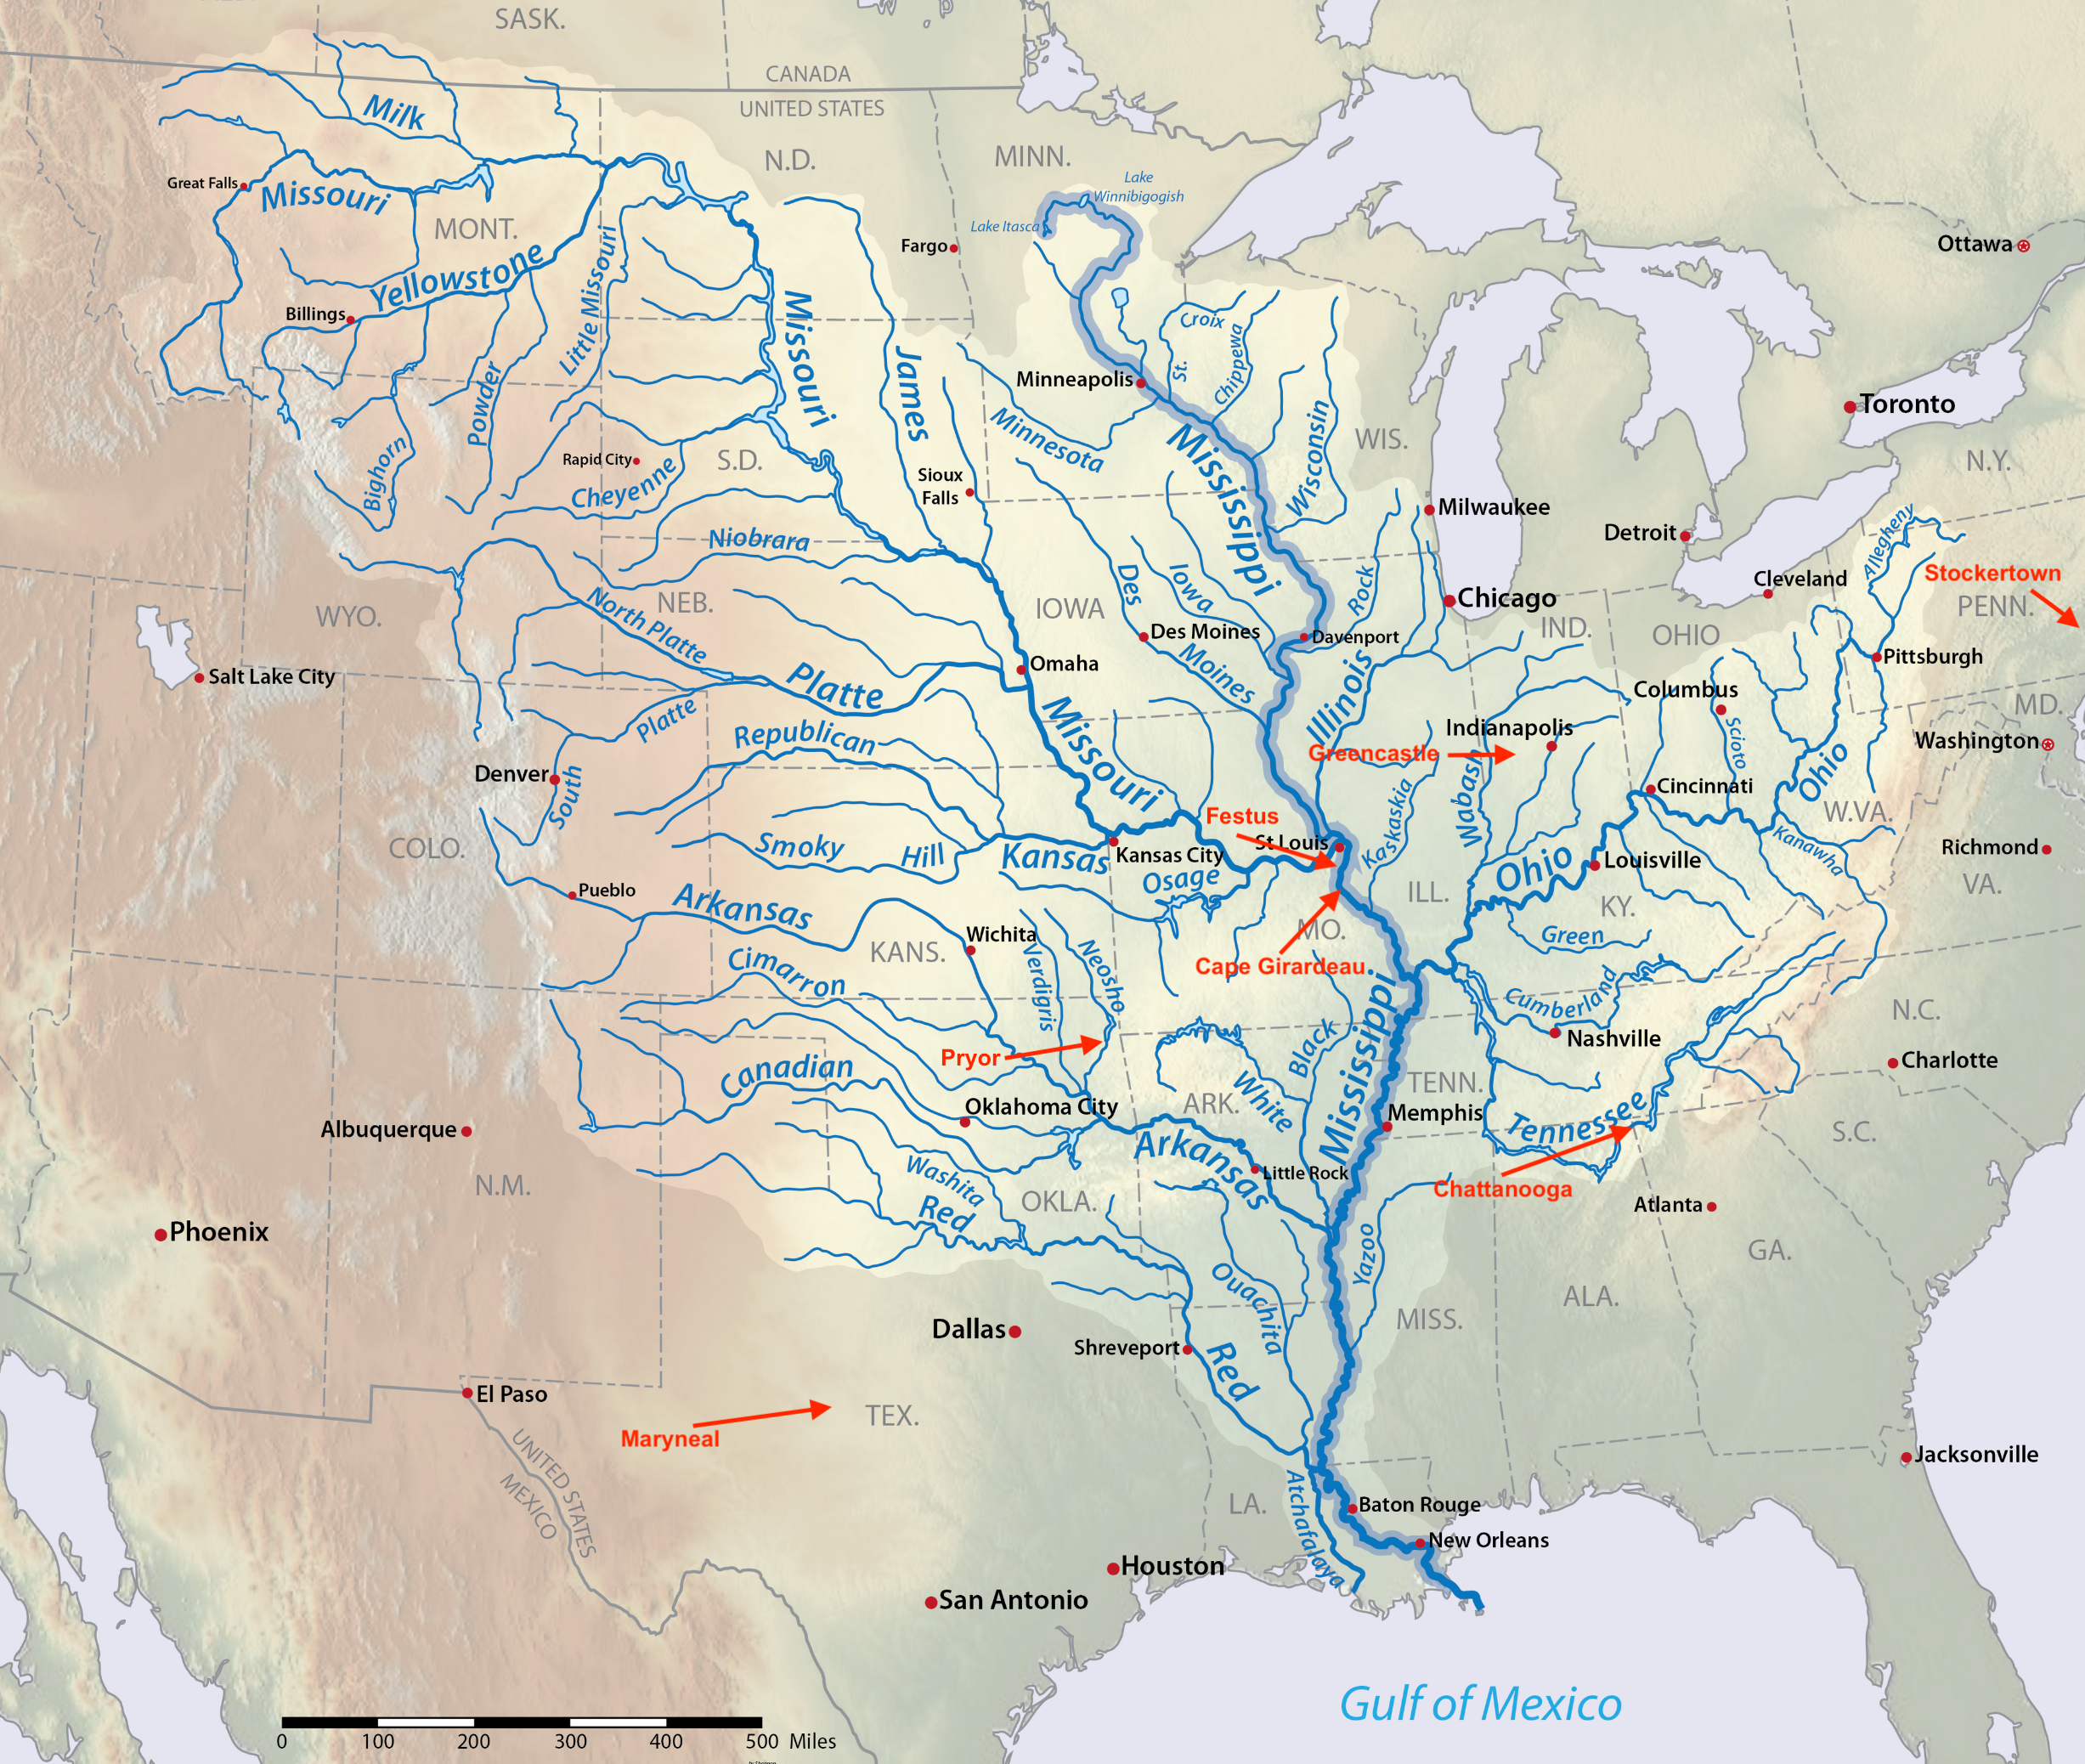
The US contains the largest connected navigable inland waterway system in the world outside the Amazon basin: the Mississippi, the Missouri, the Ohio, the Illinois, and their tributaries reaching from the Canadian border to the Gulf of Mexico.
A company with the right plants on the right banks of those rivers doesn’t compete in a local market. It competes across a continent.
Buzzi has been building exactly that position for decades.
II: The profit physics: what the river actually costs
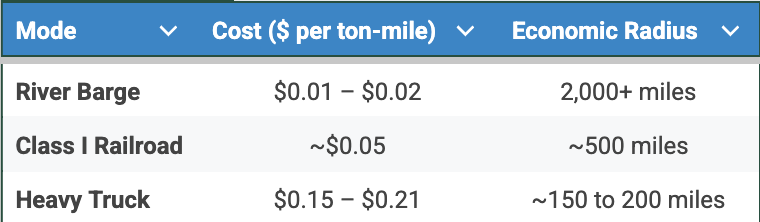
There are three ways to move bulk dry cargo across the American interior: river barge, Class I railroad, and heavy truck. Every cement producer in the country uses some combination of the three. The question is which combination, and how much the choice costs per ton of product delivered.
The differences are not marginal. They are structural, and they originate in basic physics.
A river barge in the Mississippi system moves one ton of cargo one mile burning approximately 1/600th of a gallon of fuel. A Class I freight train moves the same ton the same distance burning roughly 1/450th of a gallon. A heavy truck on the highway burns 1/155th of a gallon. The gap between water and road is not a matter of operational efficiency or fleet management. It’s about the physics of the transport method. Hydrodynamic resistance is much lower than rolling resistance on asphalt, and that physical difference shows up directly in the freight rates you pay.
The cost per ton-mile by river barge runs between $0.01 and $0.02. By Class I railroad, the average revenue per ton-mile for the major carriers has been approximately $0.051. By heavy truck, depending on diesel prices, driver availability, and route, the rate ranges from $0.15 to $0.21. Barge transport costs between three and ten times less than rail per unit of cargo moved, and between eight and fifteen times less than truck.
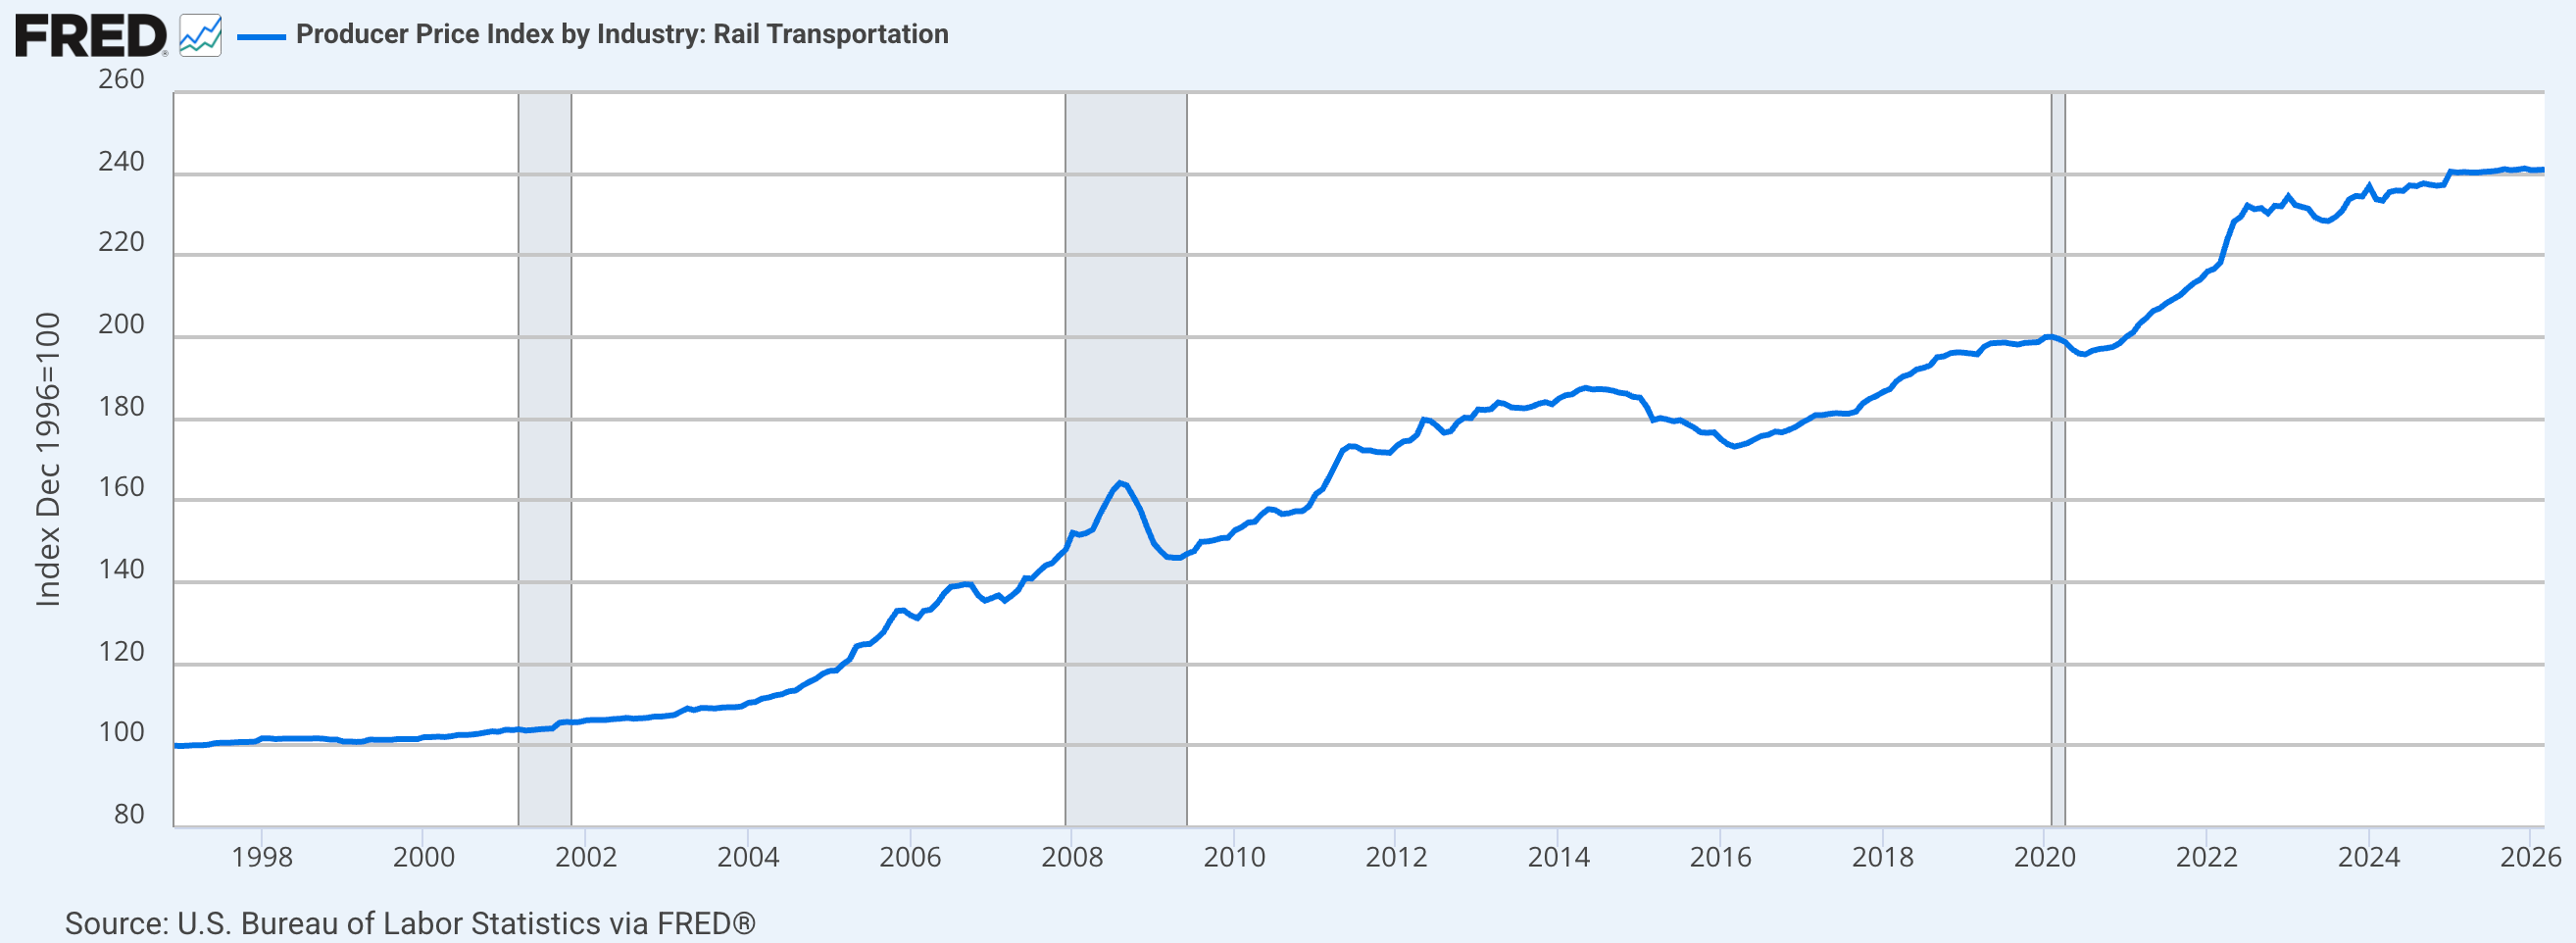
The Bureau of Labor Statistics tracks producer price indices for each of these three transport modes separately. Plotting them together on the same chart reveals something that the table above captures in a snapshot but the historical series makes plain: the baseline structural cost gap between water and road is not a recent development, and it hasn’t been closing. The three lines move in parallel during normal periods but the distance between them, water at the bottom, truck at the top, rail in the middle, has been a constant in US logistics for decades.
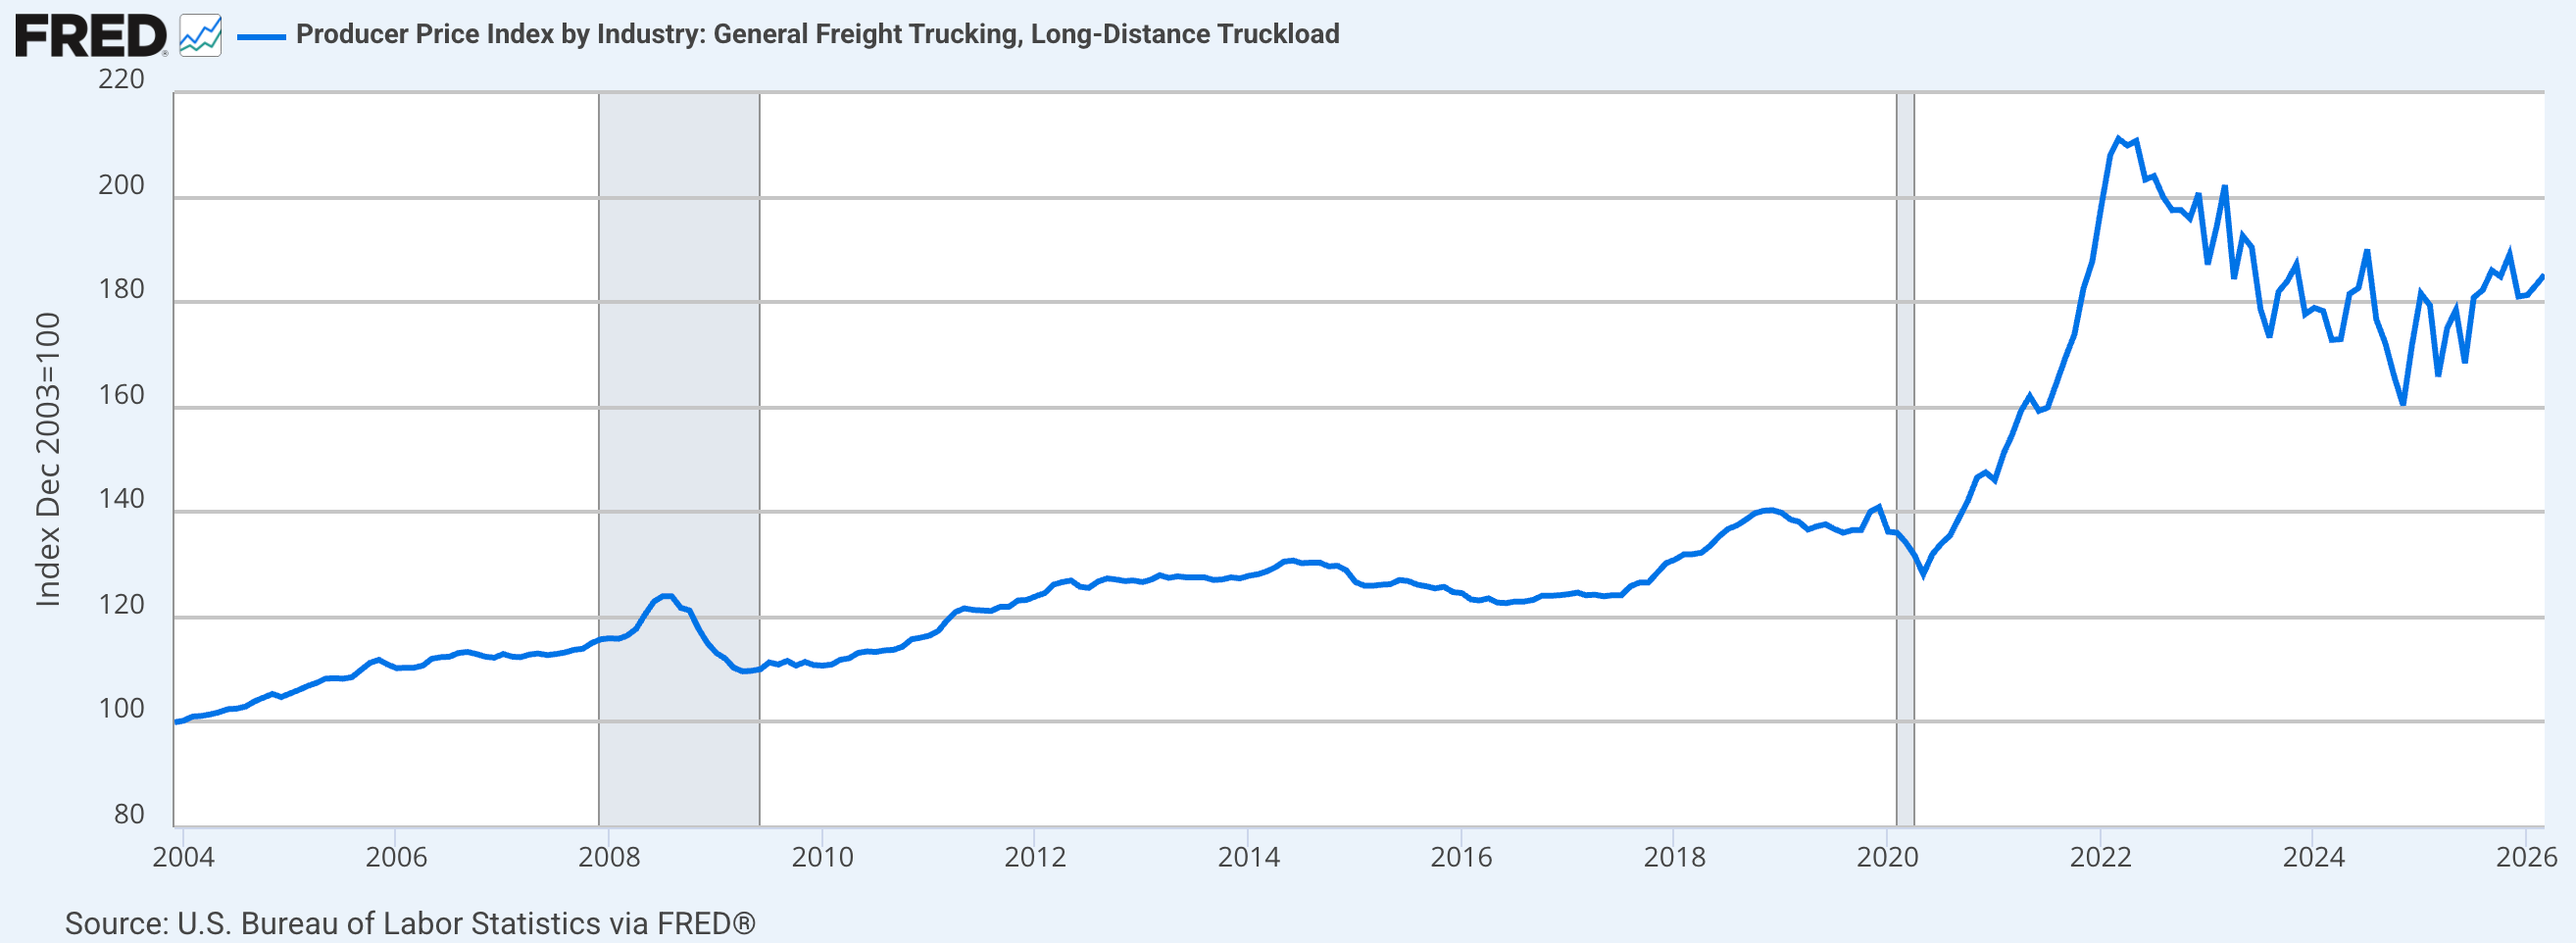

Look at the spike visible in the water freight index in late 2022. That’s the drought. The PPI index tracks contract prices rather than spot rates, so it doesn’t show the full volatility of the spot market during that time, where barge rates rose over 400% above their average. Even the more stable PPI series shows the disruption clearly. I will return to 2022 in Section VI in detail. For now the chart makes the point I want to make here: even during a major logistical crisis that limited river capacity, water freight costs started from a base much lower than trucking. Trucking costs just stayed at their usual high levels throughout.
Now apply those numbers to a real commercial route.
Festus, Missouri sits on the Mississippi at river mile 145.6, roughly 35 miles south of St. Louis. The navigable distance from Festus downstream to the port of New Orleans is approximately 1,000 miles. At a conservative average barge rate of $0.015 per ton-mile, the freight cost for that entire journey is $15 per ton of cement. Cement at the factory gate in the US has been trading at roughly $150 per ton in recent years. Buzzi’s freight cost from its flagship plant to the largest port on the American Gulf Coast consumes exactly 10% of the product’s value.
Now consider the position of a competing producer located inland, without river access. Heidelberg Materials operates a large plant in Mitchell, Indiana, one of the biggest cement facilities built in the United States in the past two decades. Mitchell is roughly 800 rail miles from New Orleans. At $0.051 per ton-mile, the freight cost to serve the same Gulf Coast market is $40.80 per ton, nearly three times Buzzi’s cost for a journey that’s actually shorter in absolute miles.
That $25.80 per-ton penalty is not a rounding error. In a commodity industry where prices are largely determined by local supply and demand dynamics and where EBITDA margins across the US industry average somewhere in the low-to-mid twenties percent, an embedded cost disadvantage of more than $25 per ton on every unit shipped to a distant market is commercially disqualifying. The Mitchell plant is an exceptional asset in Indiana. It cannot economically contest the Gulf Coast markets that Buzzi serves from Festus.
The same logic works in reverse. A producer in Louisiana trying to ship north to compete with Buzzi in Missouri and Illinois faces the same cost calculation. Shipping upriver is slower and more expensive than downriver, but the advantage stays with the operator on the water. Buzzi’s plants are already in that position.
The truck case is even clearer. A producer without river or rail access, serving its market entirely by road, spends $30 per ton on freight after just 200 miles. That’s 20% of the product’s value gone before the first dollar of margin is earned. Beyond 200 miles, the math stops working. This is the cage most cement plants operate in: a circle of roughly 150 to 200 miles beyond which their product cannot be delivered profitably. These geographic limits aren’t due to strategy or regulations. They’re driven by the cost of trucking versus rail versus barge transport.
Buzzi’s plants on the Mississippi are not in that cage. They operate in a corridor that runs from Minneapolis to the Gulf of Mexico, over 1,500 miles of navigable water, at freight economics that make nonsense of the truck-radius math that governs every inland competitor. The river is not a feature of the business. It’s the architecture of the business.
And here is the point I want to make clearly before moving to the next section, because it’s the one that took me longest to realize: this advantage is not operational. It doesn’t come from better management, smarter logistics planning, or more efficient fleet utilization. Those things matter at the margin, but the underlying advantage exists regardless of who runs the company. Water transport is structurally more efficient than road transport. That’s a physical fact, not a strategic choice. It doesn't change with competition, regulation, or price cycles.
Now let me show you exactly what those assets look like, and why it took four decades to assemble them.
III: The network: nodes on a river, not plants in a market
Start with the names. Buzzi built its US business over forty years through acquisitions and organic investment, the subsidiaries they bought or started have very direct names based on their locations: River Cement Company. River Cement Sales Company. Heartland Cement Company. Signal Mountain Cement Company.
Nobody hired a branding agency to name these subsidiaries. The names are operational descriptions written by people who understood exactly what they were building: a business whose identity, competitive position, and economic logic were inseparable from the river system that runs through the center of the American continent. The corporate register tells you the thesis before the financials do.
The assets fall into two groups: production plants on the river that manufacture the cement, and distribution terminals along the waterways that keep inventory near where it’s used. You have to look at how these two interact to understand how the network actually works.
The production assets
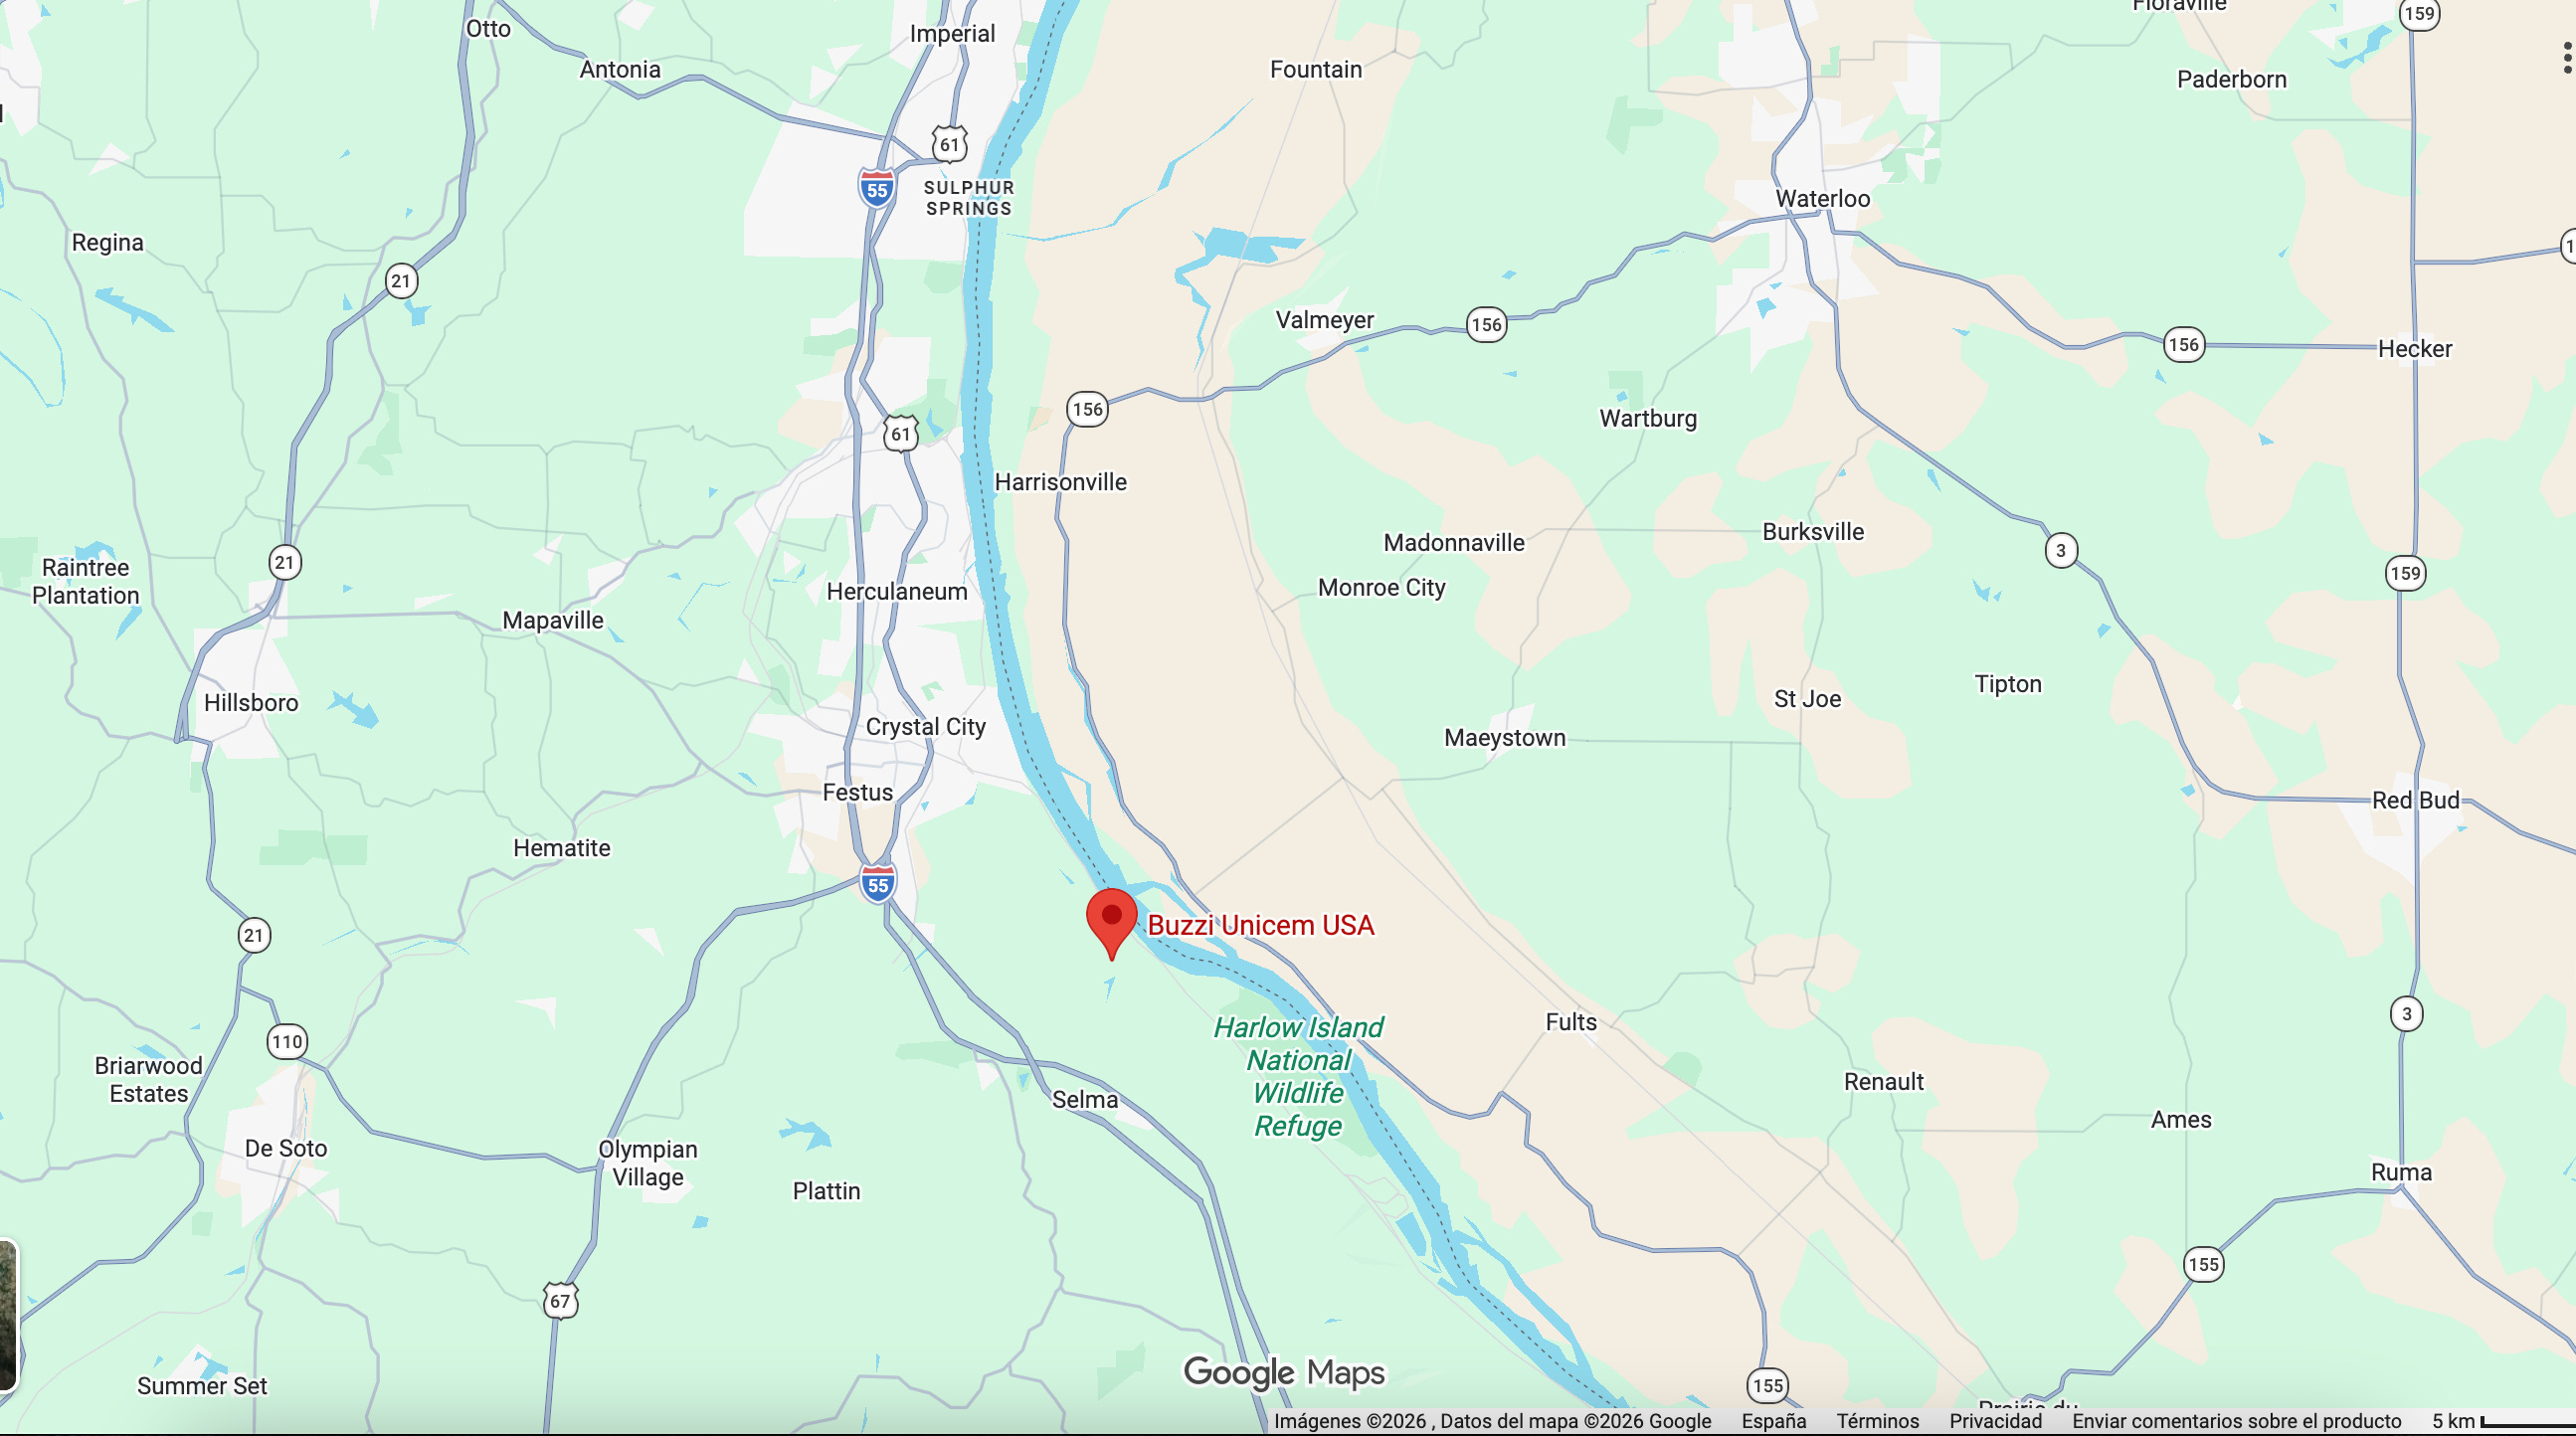
Buzzi operates eight cement plants in the US. For the purposes of this article, two of them are the ones that matter most for the river story, because they are the ones physically connected to the Mississippi.
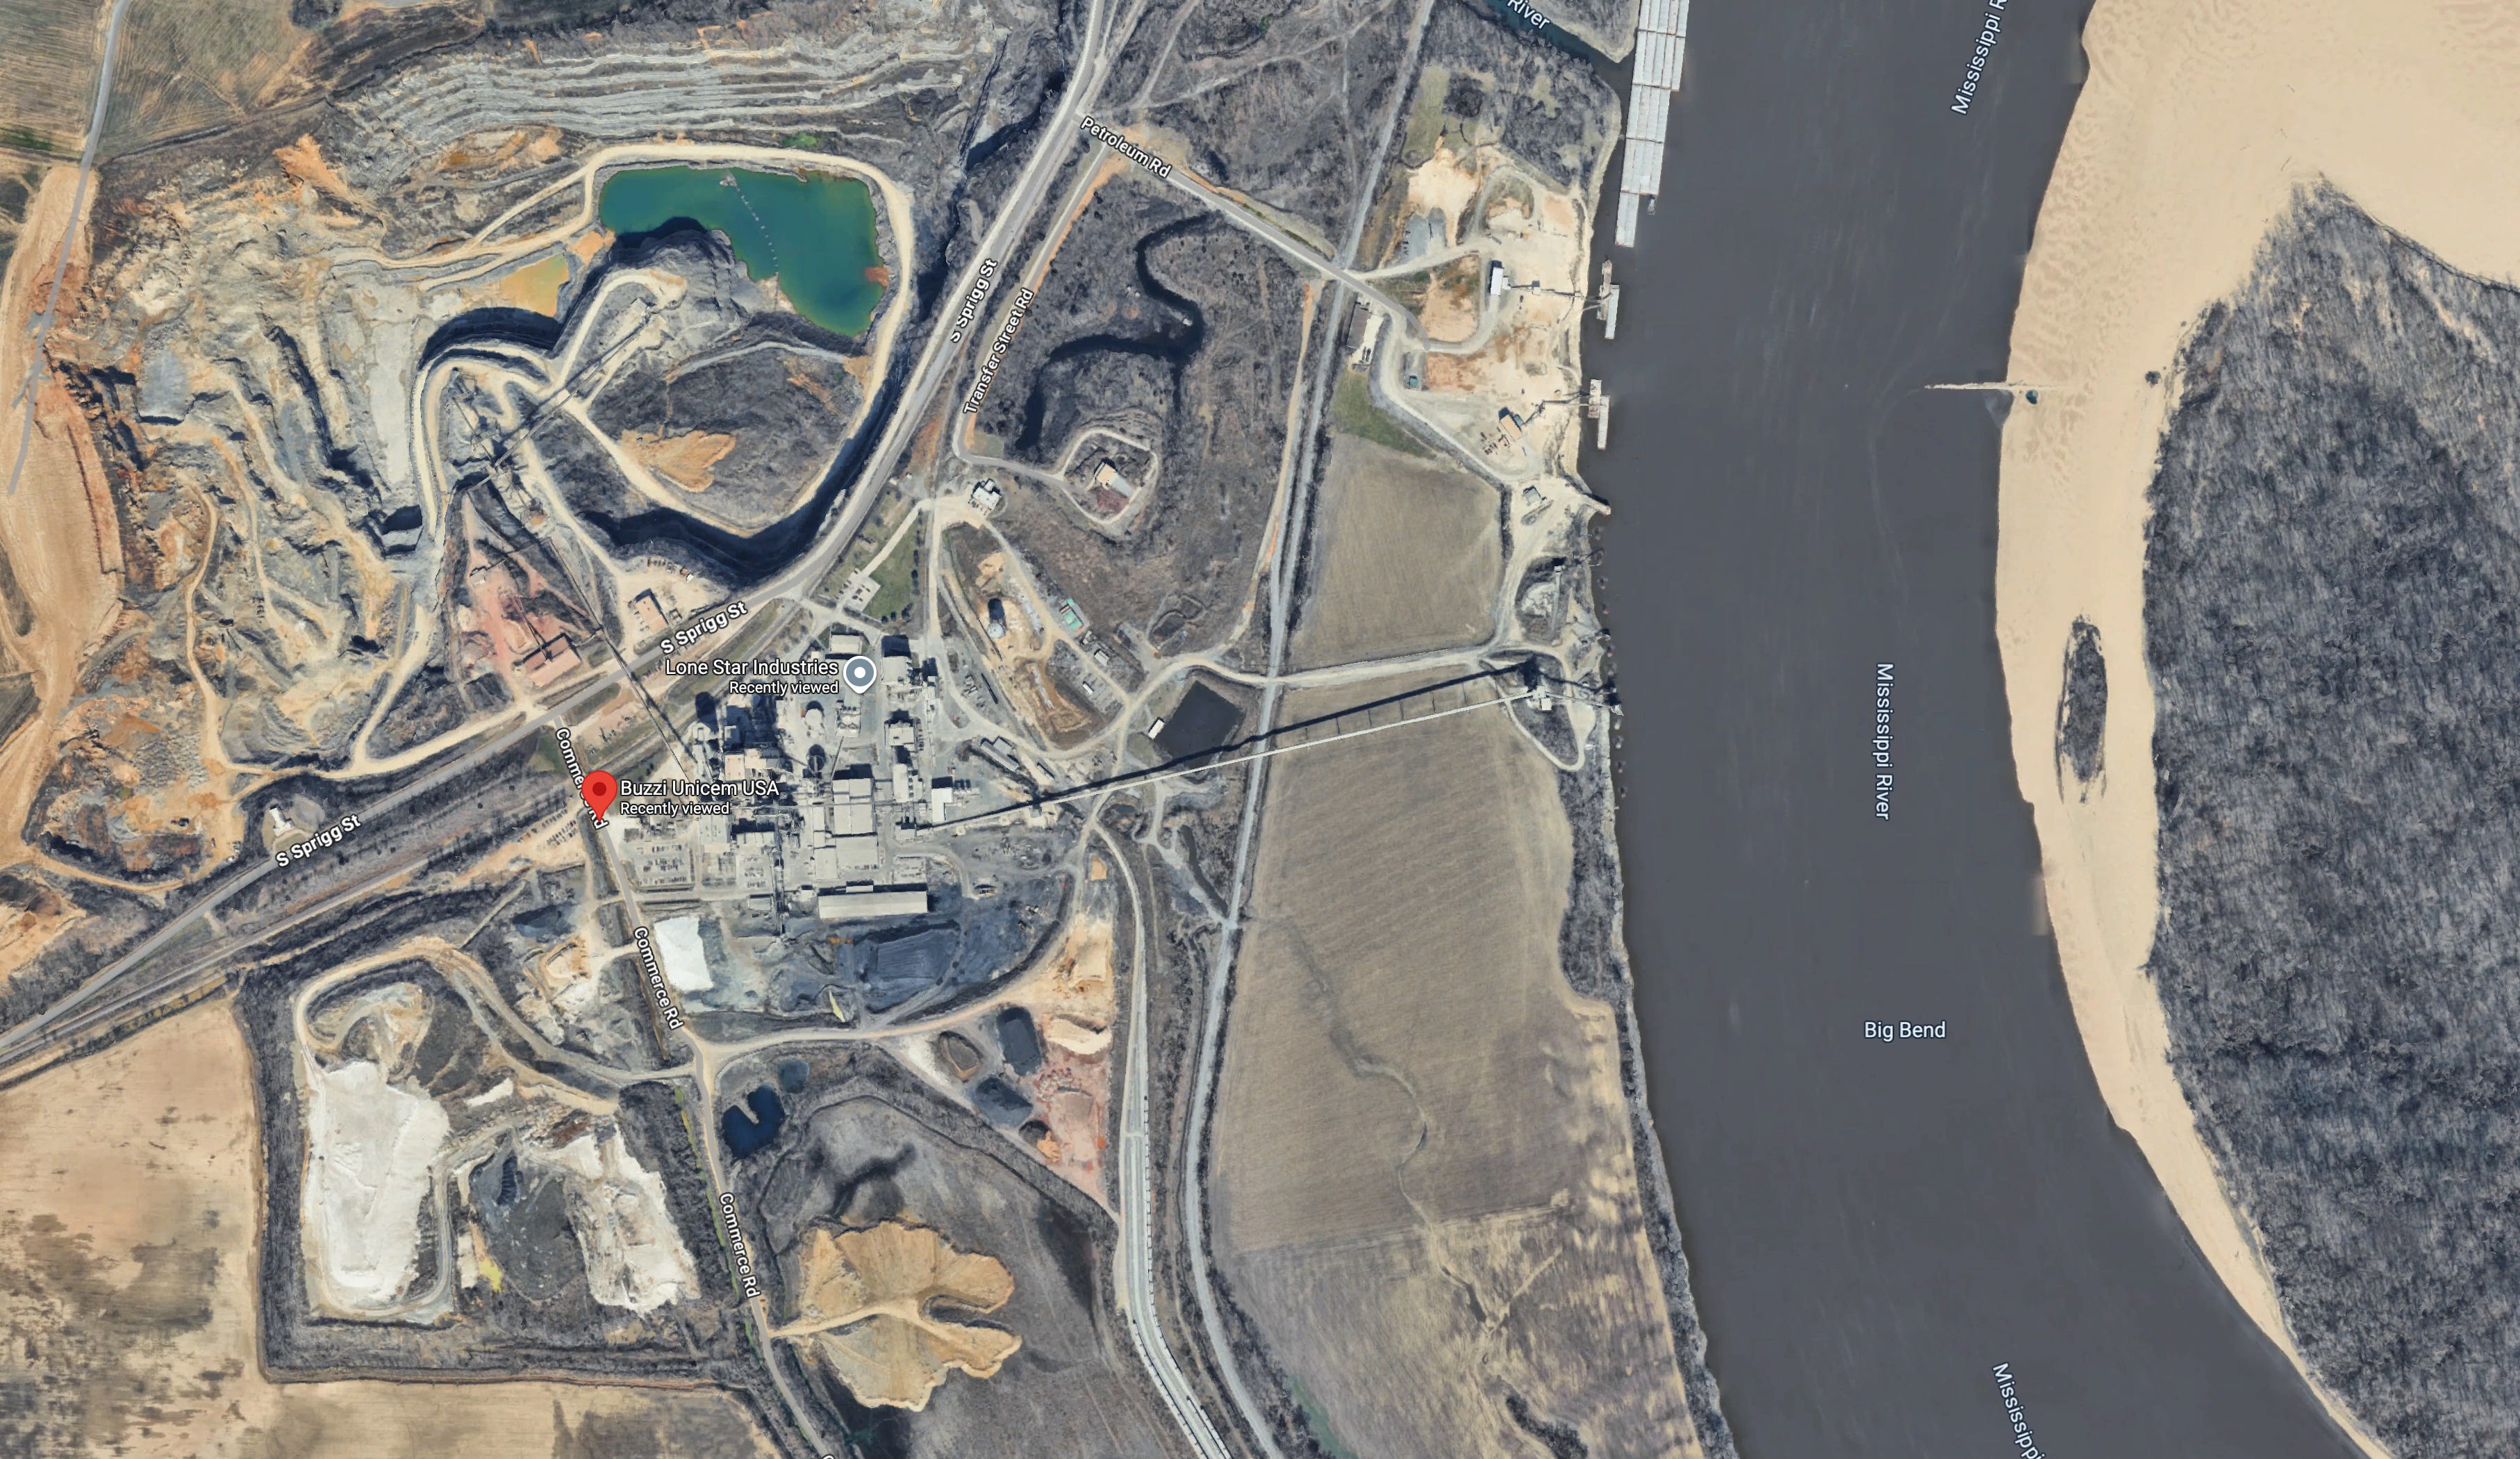
Festus, Missouri. This is the main asset. The plant is at mile 145.6 of the Mississippi, 35 miles south of St. Louis, and it’s one of the largest in North America. It’s been in its current setup since 2009, when Buzzi completed a project called River 7000: the replacement of two aging long dry kilns with a single five-stage preheater/precalciner line built by KHD Humboldt Wedag, one of the premier kiln engineering firms in the world. The result was a facility capable of producing approximately 2.7 million tons of cement per year, with a conveyor system that loads directly onto river barges at a rate of 1,000 tons per hour. There is no trucking step, no intermediate handling, no transfer to rail. The cement moves from the finish mill to the barge hold in a single continuous mechanical operation that terminates at the water’s edge.
Understanding what it would cost to build this plant today from scratch matters for understanding why no competitor has done it. Heidelberg Materials, one of the largest cement producers in the world, completed a new 2.8 million ton plant in Mitchell, Indiana in 2023 at a reported cost of more than $600 million. Festus has a slightly lower capacity but it’s located on the river, which Mitchell doesn’t. A replacement cost estimate for Festus, including the river access, kiln tech, terminals, and the environmental permits a new project would need today, is between $650 million and $800 million at current construction costs. You’re looking at what a competitor would have to spend just to match this setup, before they generate any revenue from the investment.
Cape Girardeau, Missouri. The second production plant on the river is further south along the Mississippi. Cape Girardeau is smaller than Festus, but significant for two reasons that rarely appear in analyst discussions of the company. First, Buzzi is actively expanding the limestone reserves for this plant: in 2024, invested $27.6 million in reserve acquisition and development at Cape Girardeau. That $27.6 million secures decades of production rights. It’s not maintenance capital. Second, Cape Girardeau operates a Treatment, Storage and Disposal facility certified under the Resource Conservation and Recovery Act, meaning it’s legally authorized to receive and co-process industrial hazardous and non-hazardous waste as an alternative fuel source. The energy economics of that certification, and why it matters structurally, I’ll return to in Section V. For now, the important point is that Cape Girardeau is not just a cement plant on a river. It’s a certified industrial facility with a set of operational capabilities that took years and significant regulatory capital to establish.
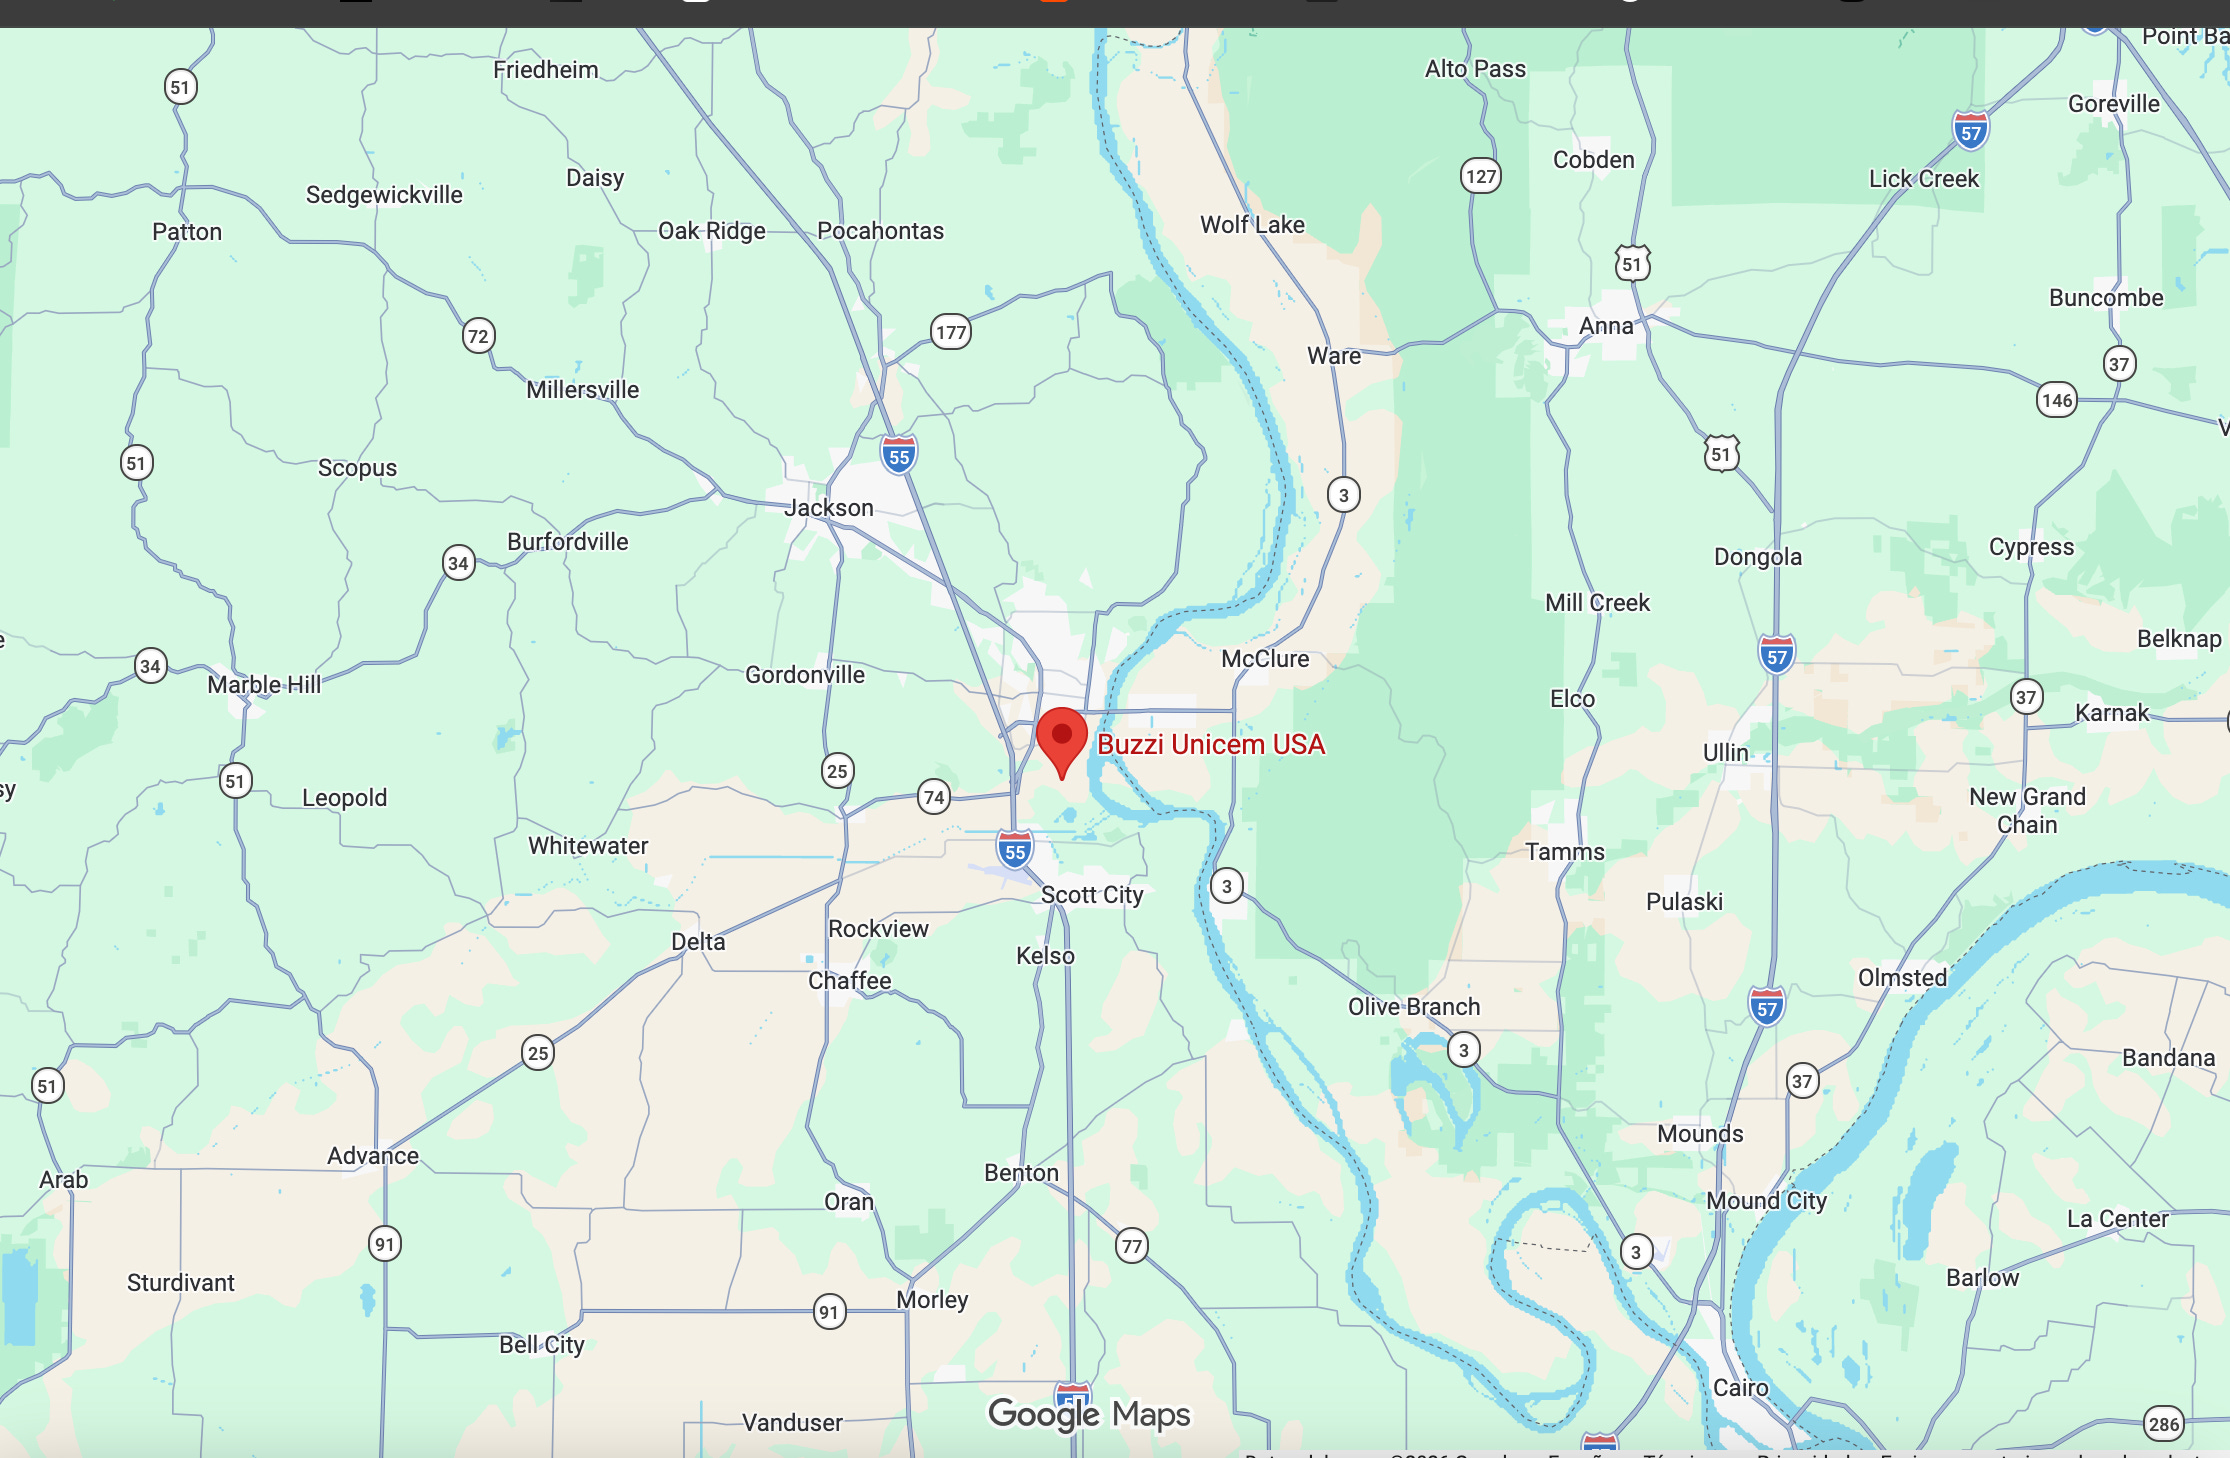
The terminal network
A cement plant that produces but cannot distribute is a pile of limestone with a kiln attached. The production economics of Festus and Cape Girardeau only convert into commercial advantage through the network of distribution terminals that positions the cement within reach of actual construction demand. This is where the scale of Buzzi’s investment over four decades becomes visible.
Buzzi operates 36 river and waterway terminals across the Mississippi system. To put that figure in context: Holcim, one of the three largest cement producers in the world by volume, operates 19 river terminals in the Mississippi basin. The combined platform created by the merger of Summit Materials and Argos North America includes two river-connected plants and a network of 10 inland distribution terminals. Buzzi has nearly twice the terminal density of the world’s largest cement producer in this specific geography.
The terminals aren’t just identical sites. Each location was chosen for a specific commercial reason, and the infrastructure is designed for its specific role in the network.
Memphis, Tennessee is a critical hub for the southern network. The terminal there holds a DomeSilo system with a capacity of 5,000 metric tons, equipped with aerated recovery technology that keeps bulk powder cement from compacting during storage, and advanced barge unloader systems that allow rapid transfer from river to silo when conditions on the river are favorable.
Cincinnati, at Sayler Park on the Ohio River, covers the eastern reach of the network. The terminal there houses multiple steel silos with a combined capacity exceeding 3,270 metric tons, built with acoustic suppression technology that allows industrial-scale cement handling in a location surrounded by residential areas. That’s not a trivial engineering detail: it’s the difference between a terminal that can operate without regulatory interruption and one that faces constant complaints and potential legal challenge from neighbors.
Rock Island, Illinois, on the upper Mississippi, covers the northern anchor of the network. It’s connected to the Union Pacific and BNSF rail networks, meaning that when the river becomes unnavigable, Buzzi can supply this terminal by train from its inland plants in Indiana or from Cape Girardeau. The river and the rail are not alternatives at Rock Island. They are redundancies.
Oglesby, Illinois located on the Illinois River, the waterway that connects Chicago and the broader Great Lakes industrial region to the Mississippi. Buzzi was actively expanding this terminal in 2024.
Bonner, Kansas extends the reach of the system along the Kansas River, a tributary of the Missouri, pushing the network’s commercial footprint into the interior of the state.
New Orleans, at the southern end, gives Buzzi access to ocean shipping for both domestic distribution and international maritime routes when economics warrant it.
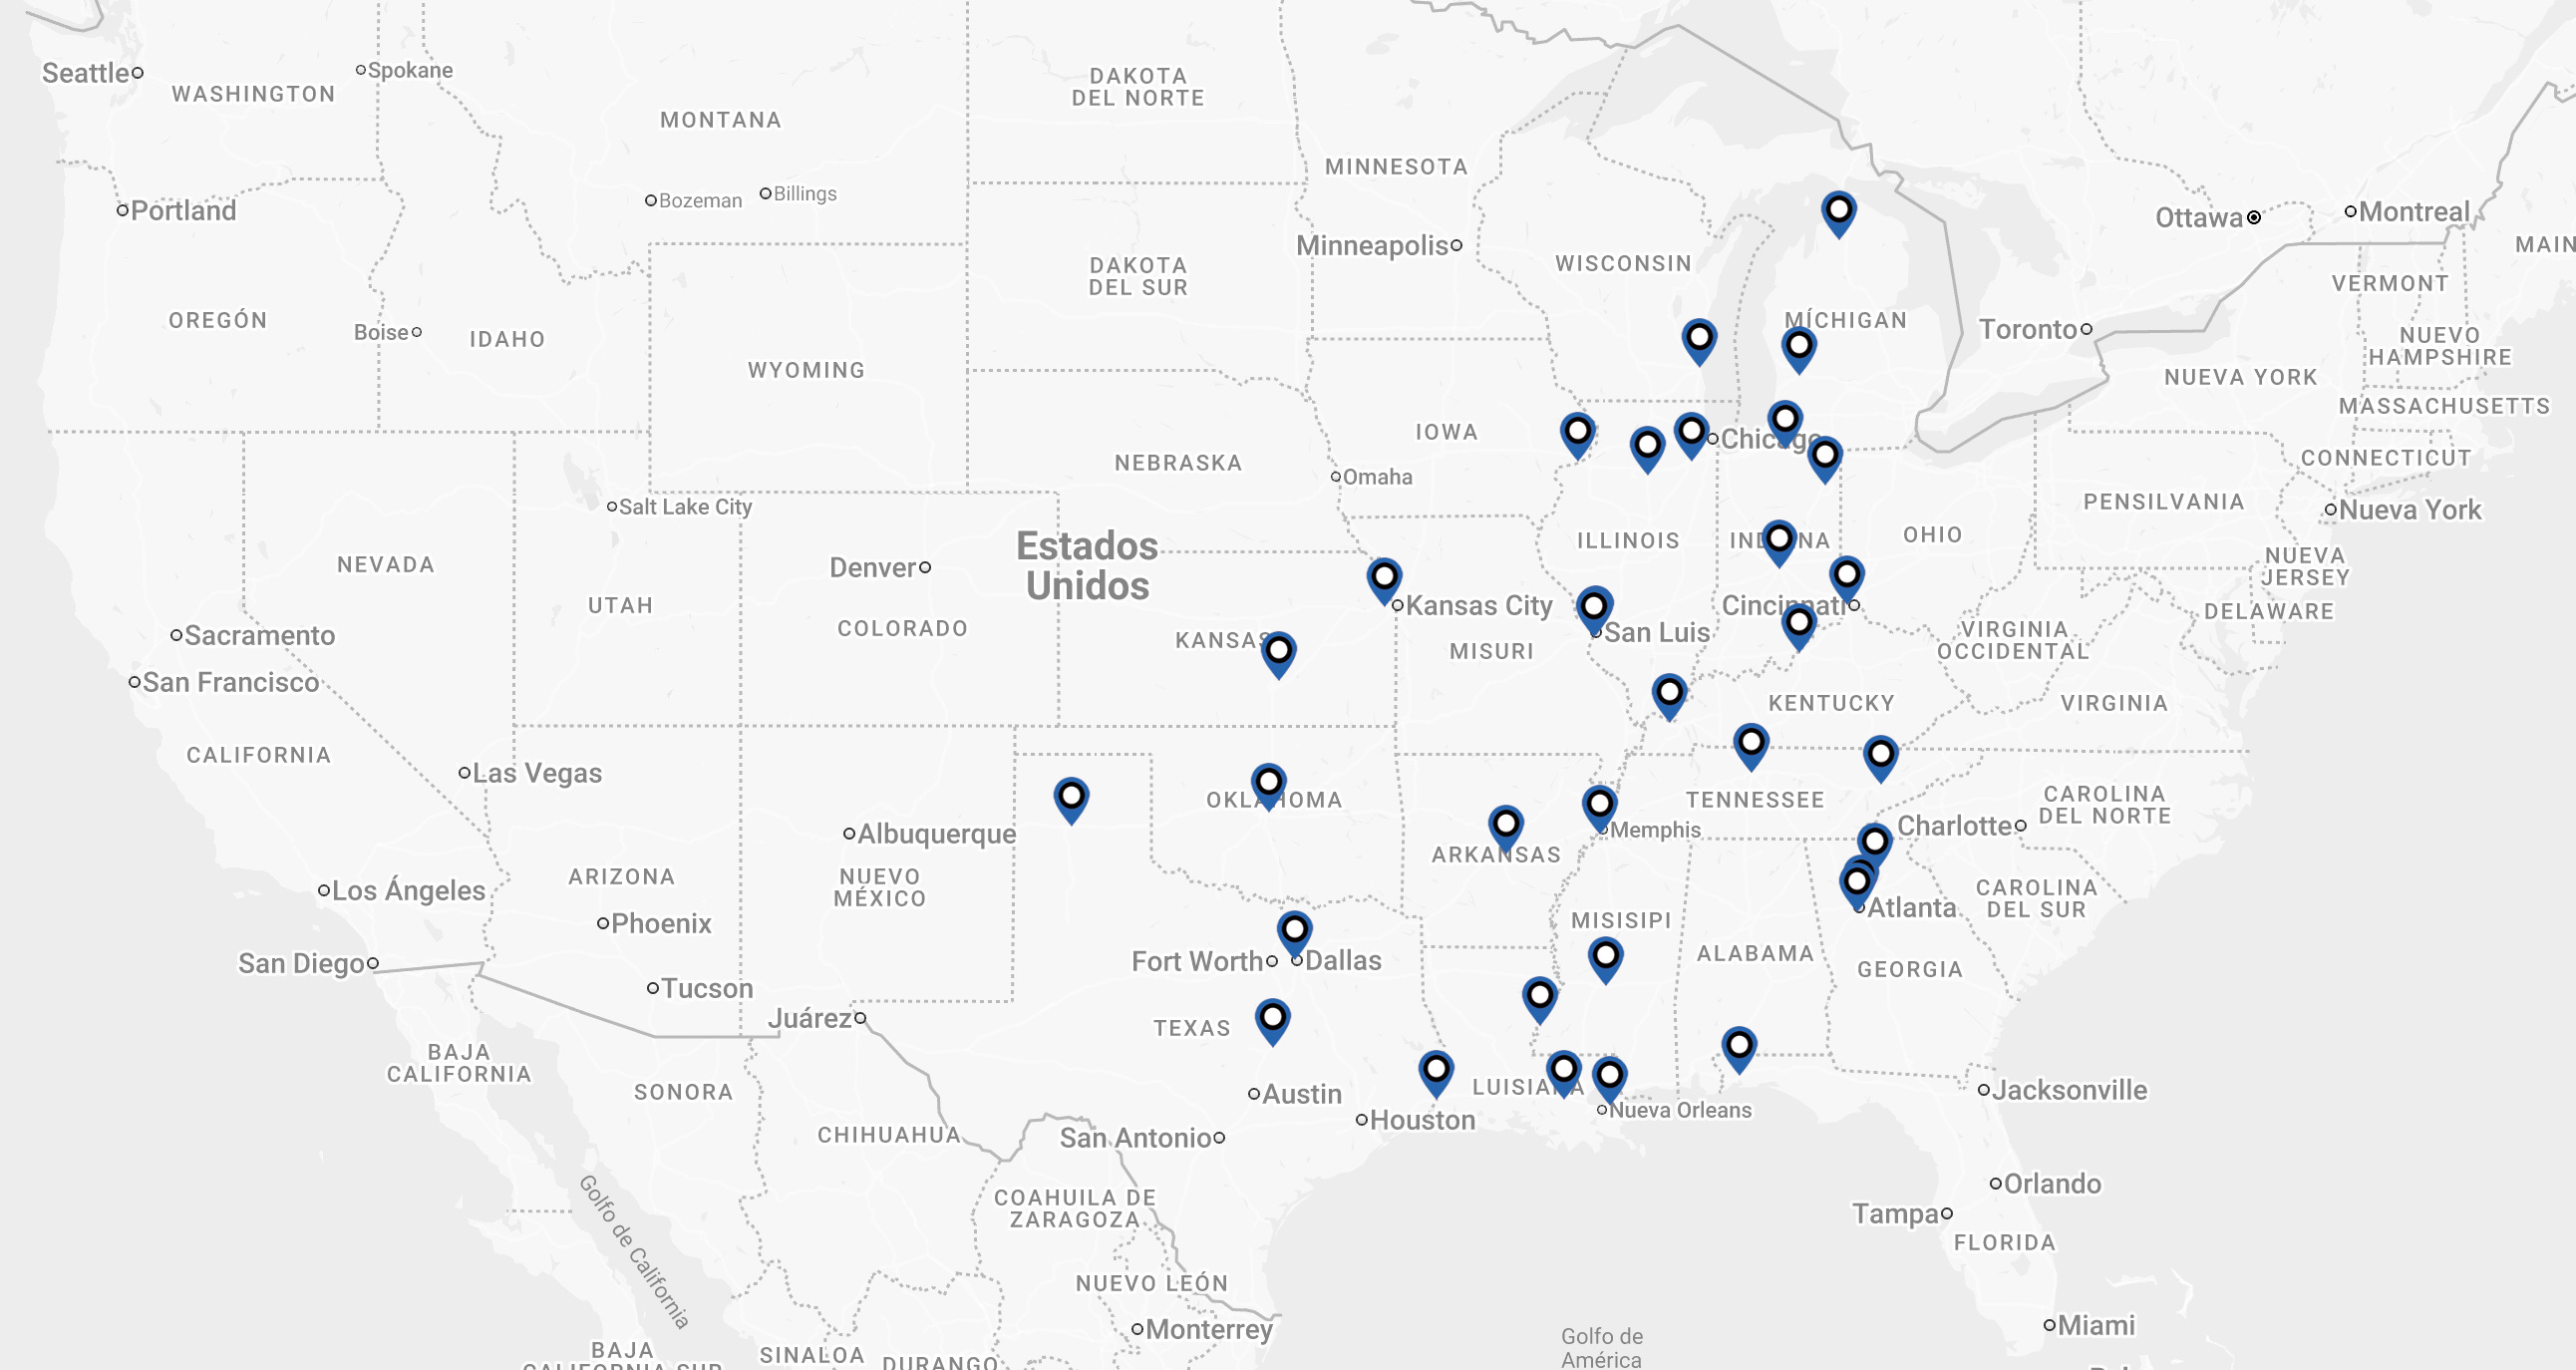
Network structure and asset geography
Looked at on a map, Buzzi’s American asset base has a structure that no other producer has replicated: plants on the main river channels, feeding terminals distributed along the tributaries like branches from a spine. Minneapolis to the Gulf of Mexico on the main channel. Chicago and the Illinois corridor. Cincinnati and the Ohio reaching east toward Pennsylvania. Kansas City and the Missouri River reaching west into the plains.
This setup isn’t accidental and wasn’t built in one deal. It’s the result of 40 years of investment, starting with Alamo Cement in 1979 and continuing with terminal acquisitions during the 2015 Lafarge-Holcim merger. When regulators forced that merger to sell assets to maintain competition, Buzzi bought three terminals: Rock Island, Grandville, and Elmira. The antitrust process meant to protect the market gave Buzzi infrastructure that its biggest competitors were forced to sell.
The competitive unit in the US market isn’t the plant, it’s the network. A single plant on the Mississippi is useful, but a plant plus 36 terminals is a different level of operation. This logistics system gives Buzzi access to demand across a geography that no truck-radius competitor can reach, it also provides redundancy and enough storage to separate production from distribution, which is critical when river levels fluctuate.
We’ll look at whether this can be replicated in the next section.
IV: The three locks: why this cannot be copied
Every time I describe Buzzi’s Mississippi network to someone who hasn’t looked closely at the company, I get the same reaction. The advantage makes intuitive sense, but the natural follow-up question is immediate: if the position is this good, why has no well-capitalized competitor built something equivalent? Holcim has a larger balance sheet than Buzzi. Heidelberg Materials has more plants globally. CRH has deployed billions of dollars in US acquisitions over the past decade. Why is the river corridor still, after four decades, effectively Buzzi’s?
The answer has three layers. Each one alone would slow a hypothetical competitor significantly. Together, they make the attempt commercially irrational.
1: Resource and Location Barriers
Every cement plant needs enough high-purity limestone to last for decades of large-scale quarrying. For a river-connected plant, the limestone needs to be in the right place relative to the water: It needs to be close enough to the water so the logistics work, but high enough to avoid flooding, and deep enough to justify the setup costs.
Finding high-quality limestone right next to a navigable river in the Mississippi system is rare. Most of them are already occupied. The ones that aren’t have already been checked out. If a site hasn’t been developed, it’s usually because of issues with the rock quality, water access, or permitting, or on some combination of all three.
Buzzi’s investment of $27.6 million in limestone reserve expansion at Cape Girardeau in 2024 makes most sense in this light. It’s money spent securing the decades of raw material supply that give the plant its long-term economic life, at a specific location on a specific river where the combination of geological quality and navigable water access cannot be replicated ten miles upstream or downstream.
A competitor entering the Mississippi corridor today would face an immediate problem: before a single permit is filed or a single engineering study commissioned, it needs to find a site where the right rock is close enough to the right water. That search would not identify virgin territory. It would identify locations that Buzzi, and the producers before Buzzi, have already evaluated over the course of a century of American cement industry history. The available geological opportunities in this corridor are not waiting to be discovered. They have been found, assessed, and either developed or rejected.
This first lock is not a patent or a regulatory protection. It’s simpler and more durable than either: the earth contains a finite amount of high-quality limestone on the banks of navigable rivers in the American Midwest, and most of it’s already spoken for.
2: Regulatory and Legal Hurdles
Building a river terminal on the Mississippi means you’ll have to deal with two main federal laws. Section 10 of the Rivers and Harbors Act requires Army Corps approval for any structure in a navigable waterway. Then there’s Section 404 of the Clean Water Act, which covers construction near the river. You’ll have to manage public comments, Environmental Impact Statements, and EPA coordination. There’s also a high risk of lawsuits from environmental groups that regularly litigate these types of projects.
In the current environment, the timeline for a new terminal is usually between five and ten years from application to approval, and that’s assuming you don’t face any legal delays. In reality, assuming no litigation is unrealistic. Organizations like Earthjustice have successfully blocked or delayed river infrastructure projects by challenging Army Corps permits, and federal agencies will revoke permits mid-process when environmental concerns are sufficiently documented.
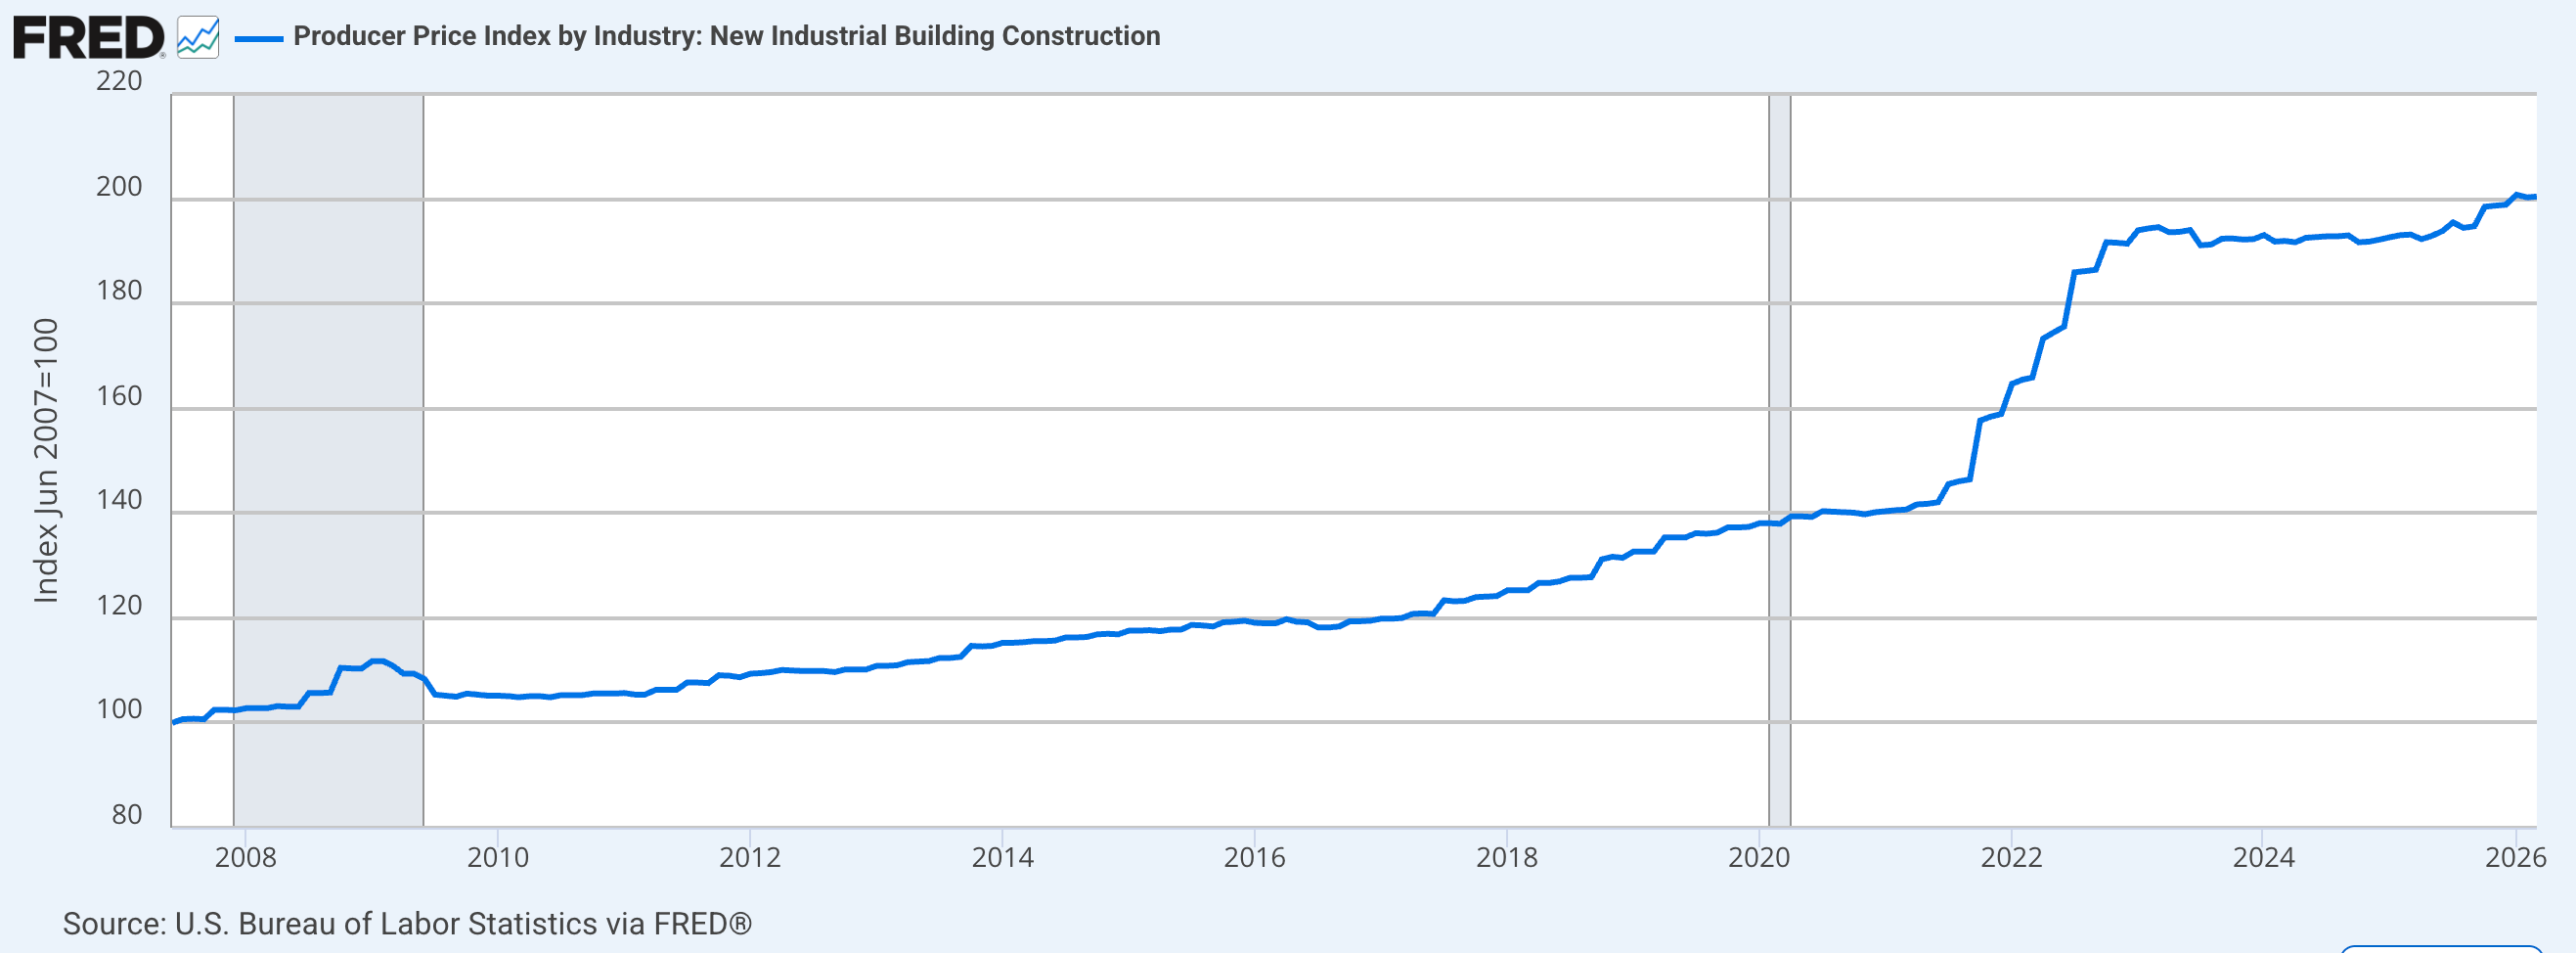
Then there is the air quality dimension. Cement manufacturing requires heating limestone to temperatures above 1,450 degrees Celsius, releasing carbon dioxide, particulate matter, sulfur dioxide, and oxides of nitrogen. Obtaining a new source permit for a cement kiln in the US today takes between seven and ten years in a non-contested scenario. Capital committed to site acquisition, engineering, and permitting runs to tens of millions of dollars before a single ton of limestone has been quarried, and that capital is fully at risk if the permit is denied at year eight.
To see how these costs look in market terms, the BLS index for industrial building construction shows how the cost of building these facilities has evolved. The trend over the last decade is very clear.
3: Historical Advantage
Buzzi’s plants don’t just have permits; they have an established track record with regulators. In the US, having a history with the EPA has real value.
For example, between 2005 and 2006, the EPA investigated the Festus plant for exceeding emission limits. By 2008, Buzzi settled the case, paid the fines, and upgraded their pollution control systems.
I am not recounting this to suggest Buzzi’s environmental record is problematic. What the episode illustrates is analytically useful: Buzzi’s existing facilities have already gone through the crucible of modern environmental enforcement and emerged with their operating permits intact and their control systems upgraded. You aren't looking at a company waiting for regulatory approval, they’ve already cleared those hurdles.
A new competitor starting today wouldn't get any historical exemptions. They have to meet current emission standards from day one. That means including the full cost of advanced filtration and monitoring systems in the initial budget. You’re looking at much higher upfront capital requirements before any operations begin.
These 3 barriers aren't legal protections that a court or a new administration can just overturn. The geology and the cost advantage of water transport don't change. Also, the strict permitting environment is the result of a 50-year trend in US environmental law. This combination creates a competitive advantage that’s very hard to disrupt.
There’s one more part of Buzzi’s US position you should look at. Most people miss it because it’s not about the cement going out, but the energy coming in. You have to understand how material flows work on the Mississippi.
V: The river flows both ways: energy arbitrage and the hidden cost advantage
Everything I have described so far about Buzzi’s river position concerns the outbound direction. Cement leaves Festus, loads onto barges, travels downstream to terminals in Memphis, New Orleans, Cincinnati, and beyond. That’s how most people see the Mississippi advantage, but it’s only part of the calculation.
The other part is the upstream flow, and understanding it requires thinking about the single largest cost in a cement plant’s operating budget.
Fuel is the main driver in cement economics. Heating limestone to 1,450 degrees Celsius requires lot of energy, and that energy represents between 25% and 35% of the cash cost of producing a ton of cement. The fuel you choose, the price paid for it, and the mechanism by which it arrives at the plant have a direct and material effect on every ton of EBITDA the facility generates.
The petcoke loop
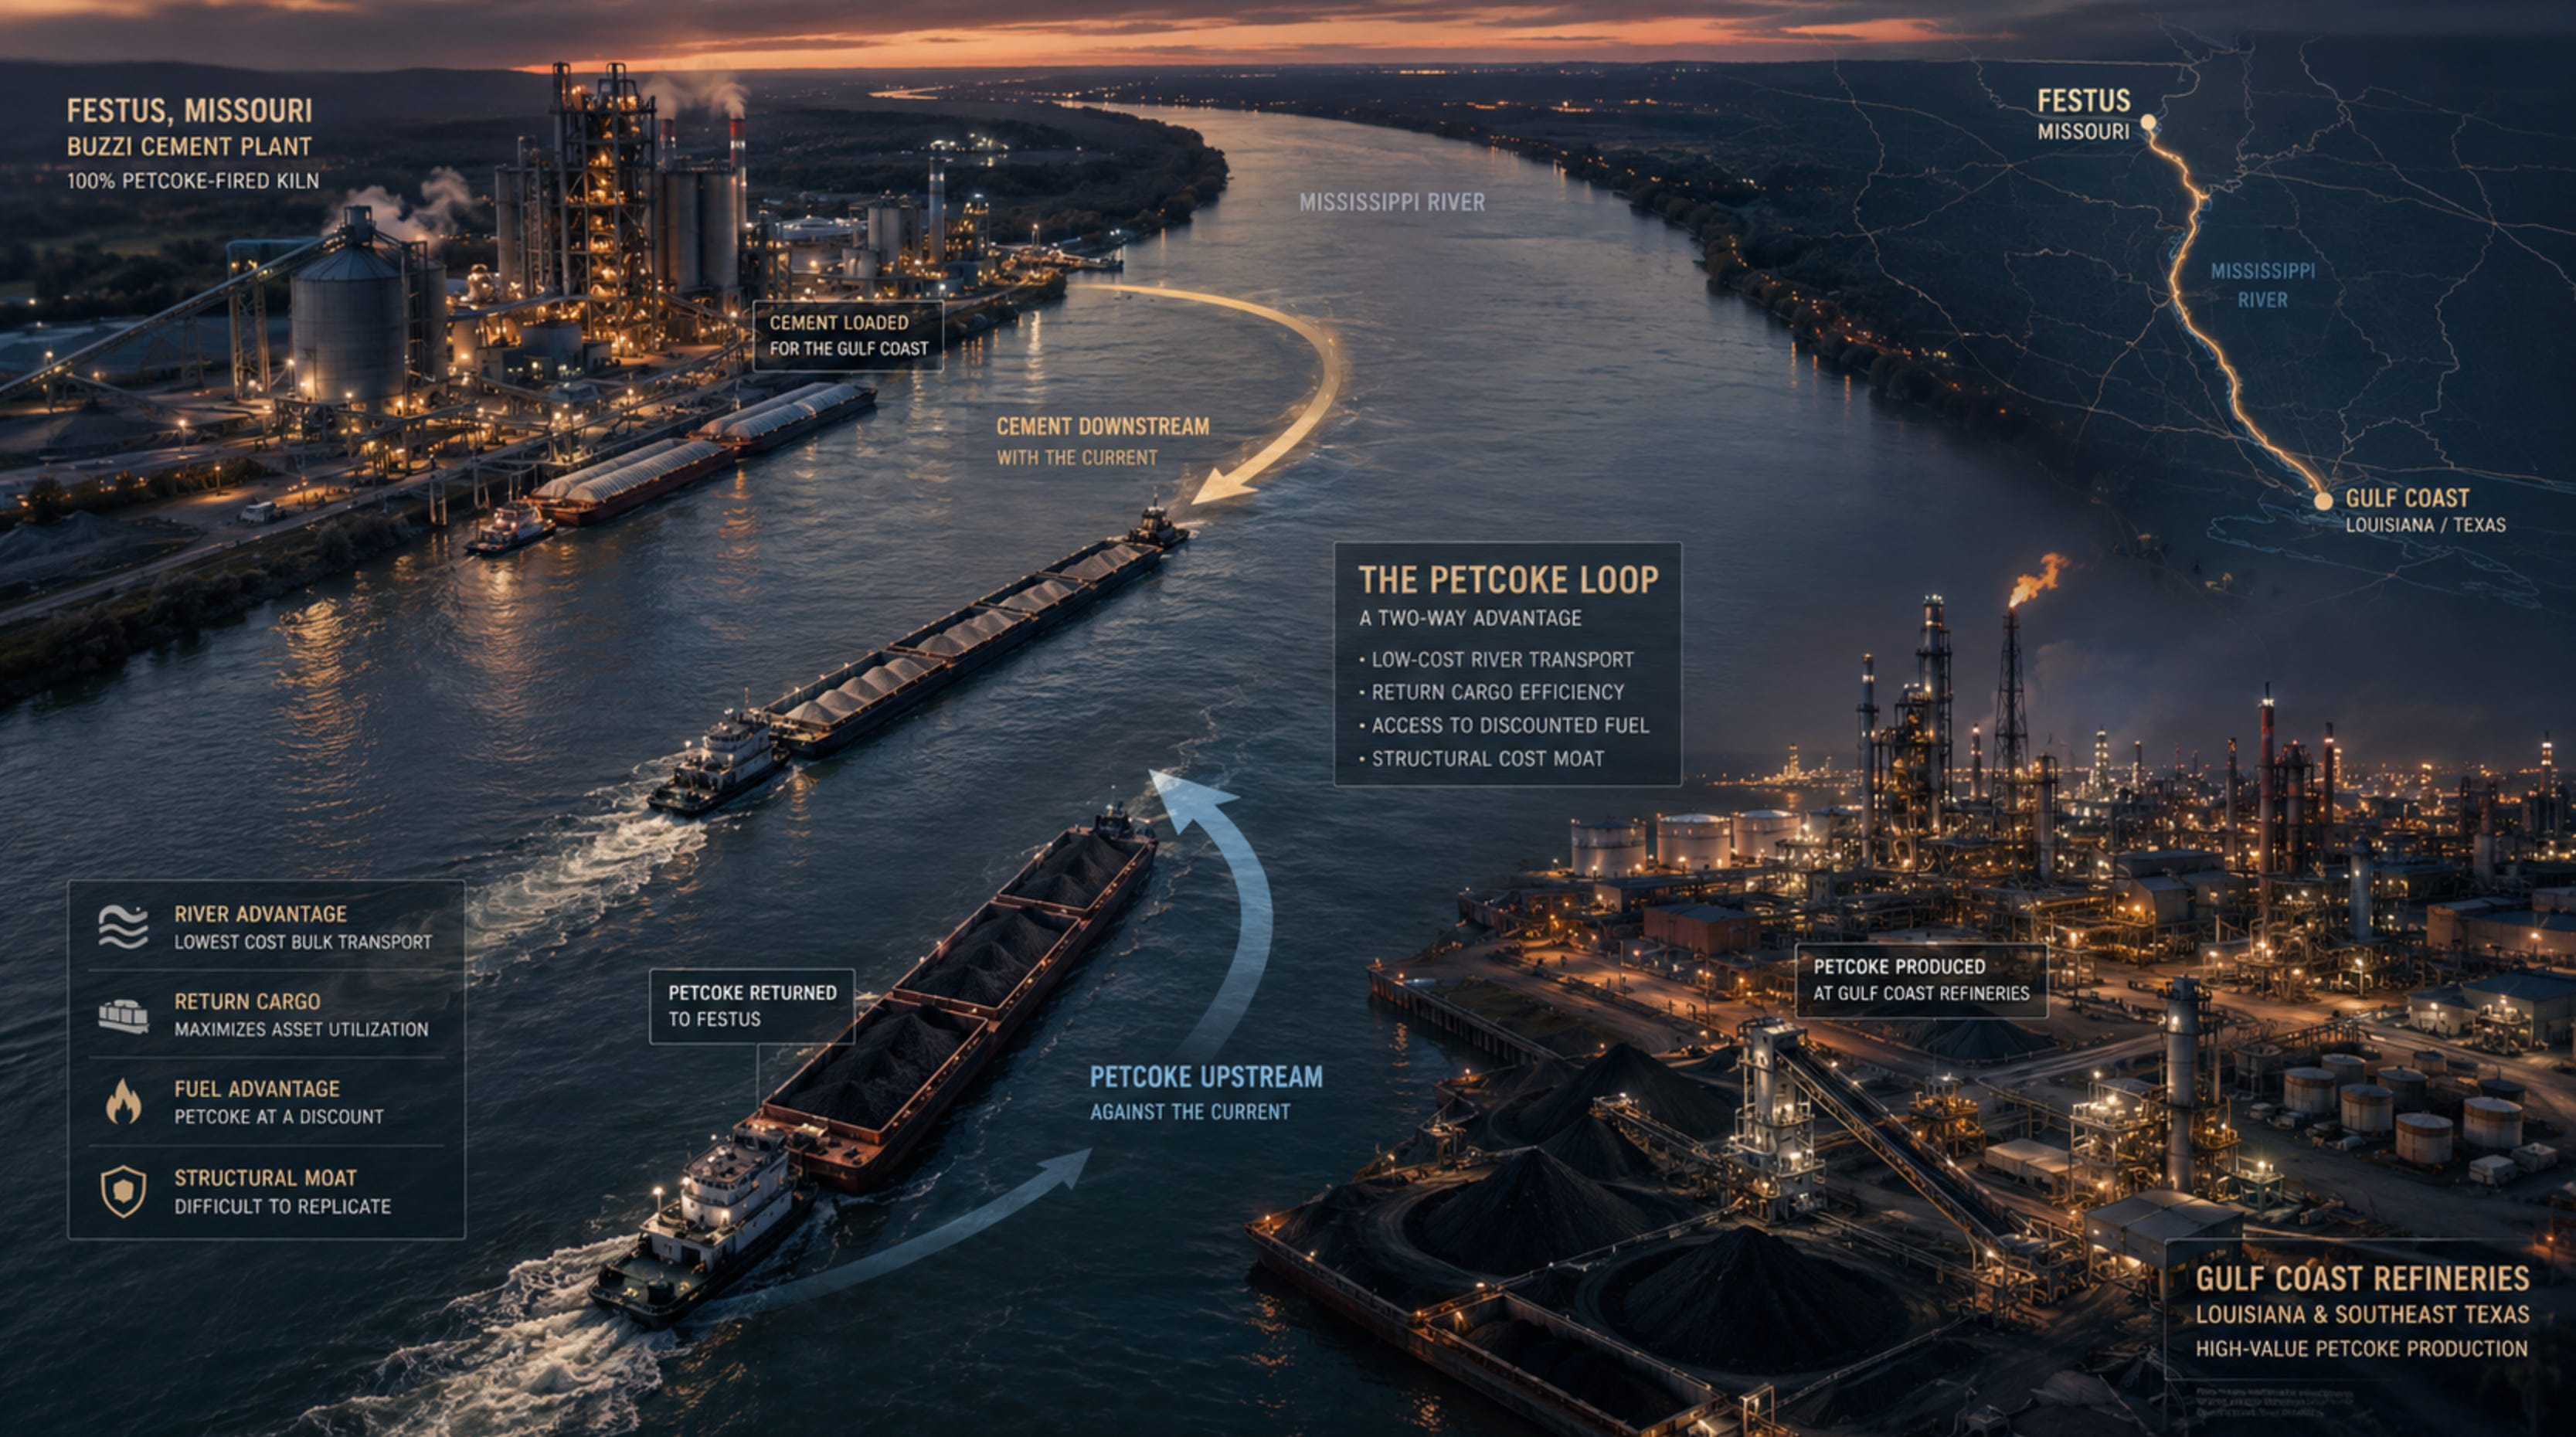
Petroleum coke (petcoke), is a dense, carbon-rich byproduct of oil refining. It’s got a high energy content and is produced in large volumes at refineries along the Gulf Coast, specifically in Louisiana and Texas. For cement kilns, petcoke is close to an ideal fuel: energy-dense, consistent in quality, and historically priced at a discount to thermal coal and natural gas on a per-unit-of-energy basis.
The Festus plant was engineered specifically to use this. During the River 7000 upgrade, they built the kiln to run on 100% petcoke. This wasn’t a random choice by the purchasing team. It was an engineering decision based on the location: the same river Buzzi uses to ship cement south also brings the petcoke up from the refineries on the Gulf Coast.
A barge leaving Festus loaded with cement for New Orleans doesn’t return empty. The return journey upstream carries petcoke purchased from Gulf Coast refineries at prices that reflect their proximity, their volume, and the low cost of water transport. The freight economics of the upstream journey are less favorable than the downstream run, because barge tows moving against the current burn more fuel and cover less distance per day, but they remain far cheaper than the alternative: buying petcoke and paying rail freight to move it inland to a plant with no river access.
Petcoke is not a stable commodity. Its price is tied to the refinery economics of heavy crude processing and moves with the oil cycle. An inland competitor without river connections absorbs the commodity price volatility in full, plus the rail freight markup on top of it.
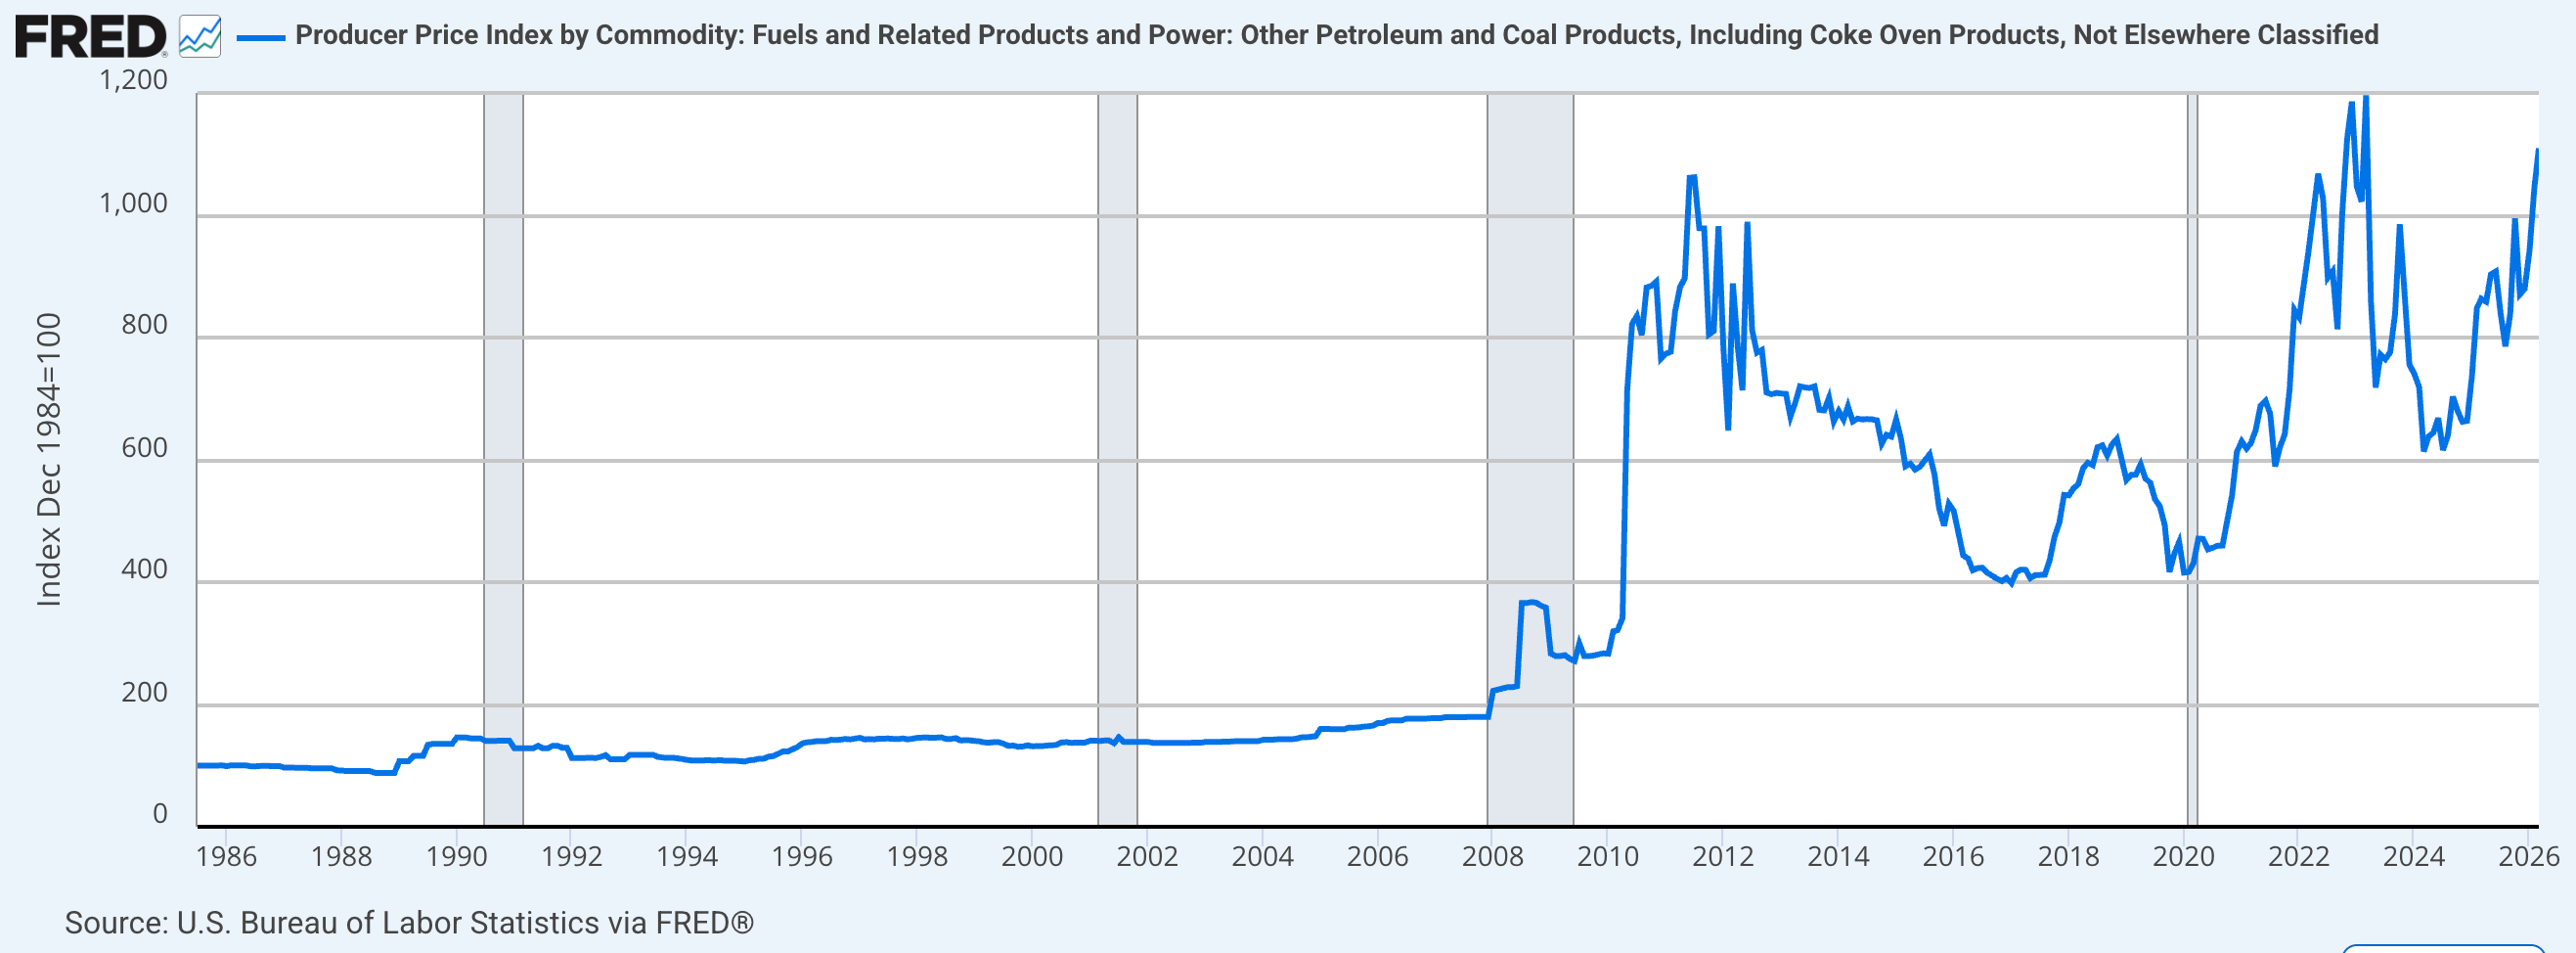
The chart makes the volatility concrete. From the lows of 2016 to the peak of 2022, the petcoke price index more than doubled. For a plant consuming hundreds of thousands of tons per year, that swing is enormous. Buzzi absorbs it at barge freight rates. An inland competitor absorbs it at barge rates plus rail freight. The difference on a fuel purchase of that scale, sustained across every year of the cycle, is a structural cost advantage that compounds quietly inside every income statement. The Mississippi doesn’t just reduce the cost of selling cement. It reduces the cost of making it.
The industrial waste business: when fuel pays you
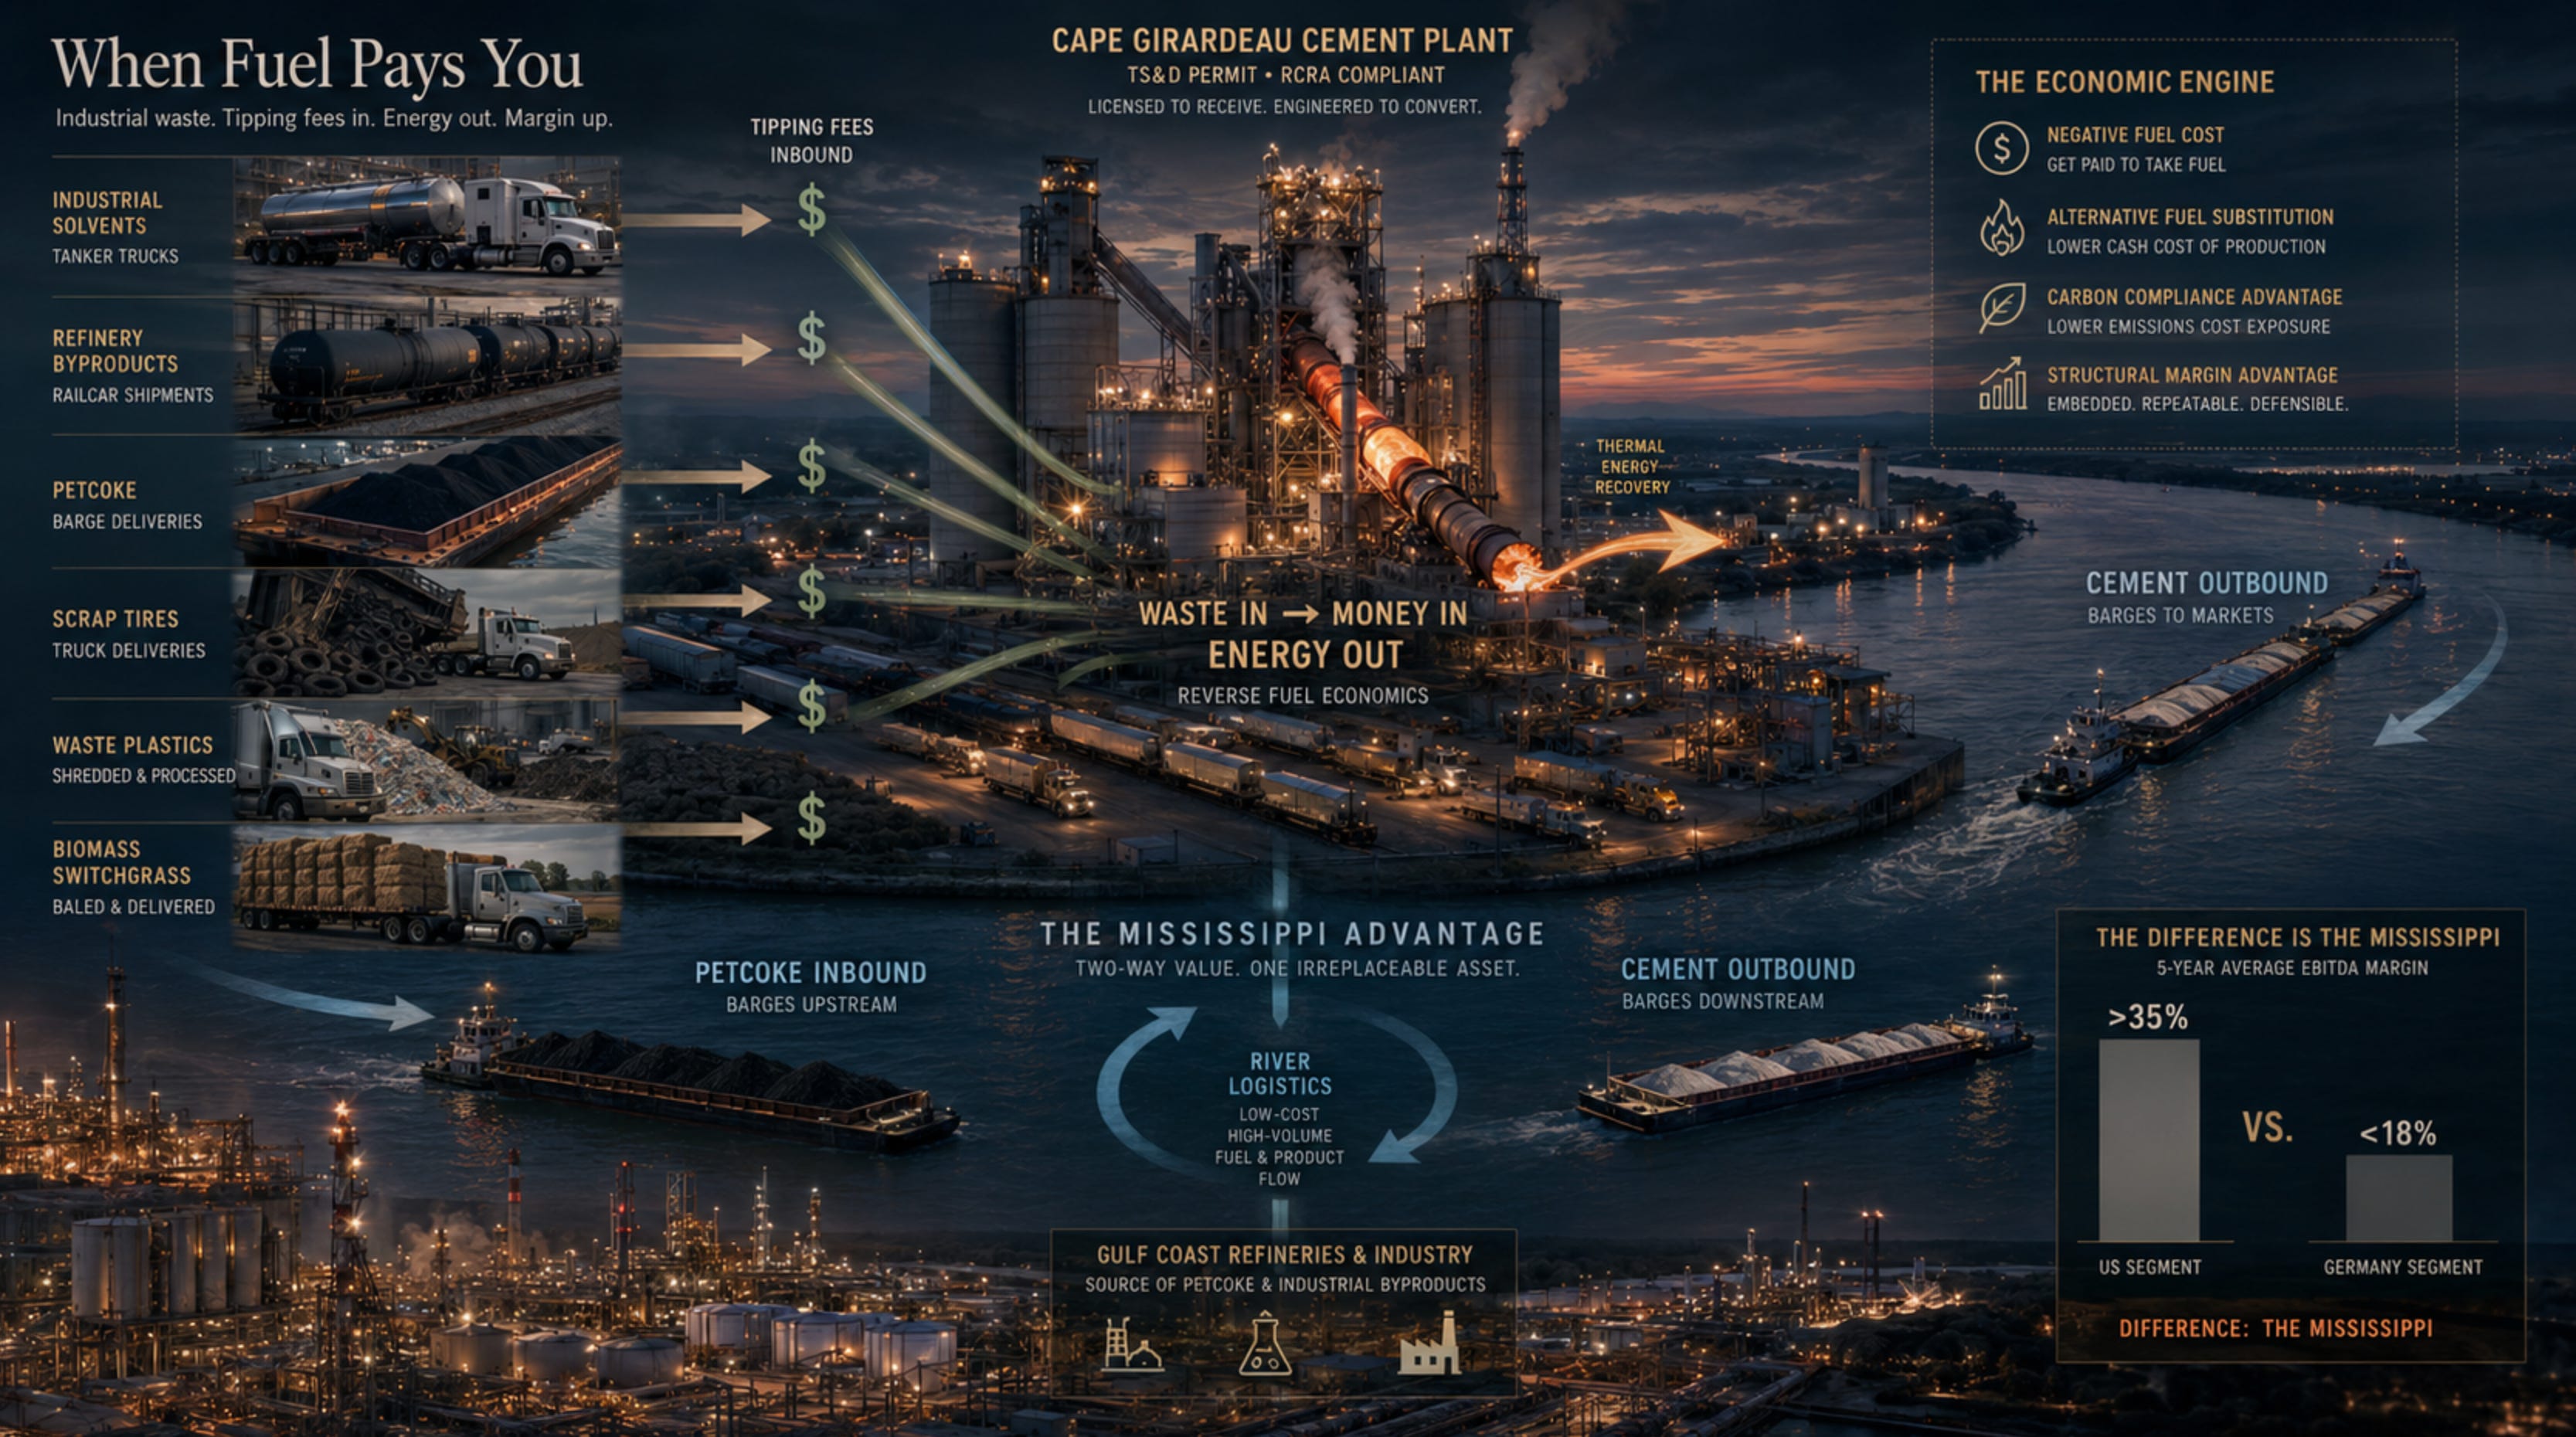
The petcoke logistics are the simplest part of Buzzi’s energy strategy. Cape Girardeau has a more advanced setup that isn't really covered in standard coverage of the company.
This facility has the permits required to handle hazardous industrial waste. Factories across the Midwest produce waste like solvents or chemical byproducts that they’re legally required to dispose of. These materials have high energy content, but you can’t burn them just anywhere. You need a licensed facility with the right tech and permits.
Cape Girardeau is one of those facilities. When they take a shipment of solvent waste from a chemical plant, Buzzi doesn’t pay for the fuel. In fact, the producer pays Buzzi a fee to take it. You’re looking at a model where Buzzi gets paid to receive the fuel they use to run their kilns.
Think through the economics of that transaction carefully. In a conventional cement plant, the energy budget looks like this: the plant buys fuel at market price, transports it to the site at freight cost, and burns it to make clinker. Cost in, product out. At Cape Girardeau, a portion of the energy budget operates in reverse. The generator pays Buzzi to receive the material. The net cost of that portion of the plant’s thermal energy is negative. Buzzi is paid to consume its own fuel.
At other plants in the Buzzi network, different variants of the same substitution logic operate. Tire-derived fuel converts end-of-life scrap tires into thermal energy with a calorific value comparable to high-quality coal. Plastic-derived fuel, branded internally as Green Fuel at certain sites, converts waste plastic streams into kiln energy. Switchgrass cultivated on marginal agricultural land adjacent to some plant sites provides a biomass fraction that qualifies as carbon-neutral under applicable regulatory frameworks.
The aggregate effect is a thermal substitution rate that reduces both the cash cost of production and the carbon compliance cost in jurisdictions where emissions carry a price. These are not separate strategic decisions. The fuel arrives by the same water that the cement leaves by. That’s the logic, stated plainly.
The combined picture is this: the Mississippi River reduces Buzzi’s cost of selling cement through distribution economics, and it reduces Buzzi’s cost of making cement through fuel supply economics. The advantage is bidirectional in the most literal sense. Every ton of cement that travels south, and every ton of petcoke that travels north, and every tipping fee that arrives at Cape Girardeau from an industrial generator with nowhere else to take its waste, all of these flow through the same physical asset.
There is no single line in the income statement labeled “Mississippi advantage.” It’s embedded in every line: in the revenue per ton that pricing power from geographic isolation supports, in the freight cost per ton that barge economics compress, in the fuel cost per ton that petcoke logistics and tipping fees reduce, and in the margin that remains when all of those lines net against each other.
That margin, in the US segment, has averaged above 35% EBITDA over the past five years. The Germany segment, operating excellent plants in a well-run market with none of the river advantages, has averaged below 18% over the same period. The gap between those two numbers is the Mississippi. It shows up in points of margin, every quarter, every year.
VI: The stress test: when the river dries up
I have spent five sections building an argument for the structural durability of Buzzi’s Mississippi position. Before the closing, honesty requires engaging seriously with the most obvious challenge to that argument: the river doesn’t always cooperate.
October 2022. The Mississippi is running at historic lows across the Midwest. The Army Corps of Engineers has cut the maximum draft to nine feet, well below the twelve to fourteen that barge operators count on in normal conditions. Tow formations that routinely lash fifteen barges together have been broken down to five. The round trip from St. Louis to New Orleans, normally fourteen days, has stretched to twenty-seven. At the worst moment, roughly two thousand barges sit stranded between Cairo, Illinois and the Gulf of Mexico, waiting for clearance that’s not coming.
The freight market responded accordingly. Spot barge rates on the lower Mississippi surged to more than 400% above their historical average at the peak of the disruption. Shippers who had not secured forward freight contracts were paying emergency premiums to move cargo that, under normal conditions, would have traveled at the lowest per-unit transportation cost available in the American logistics system.
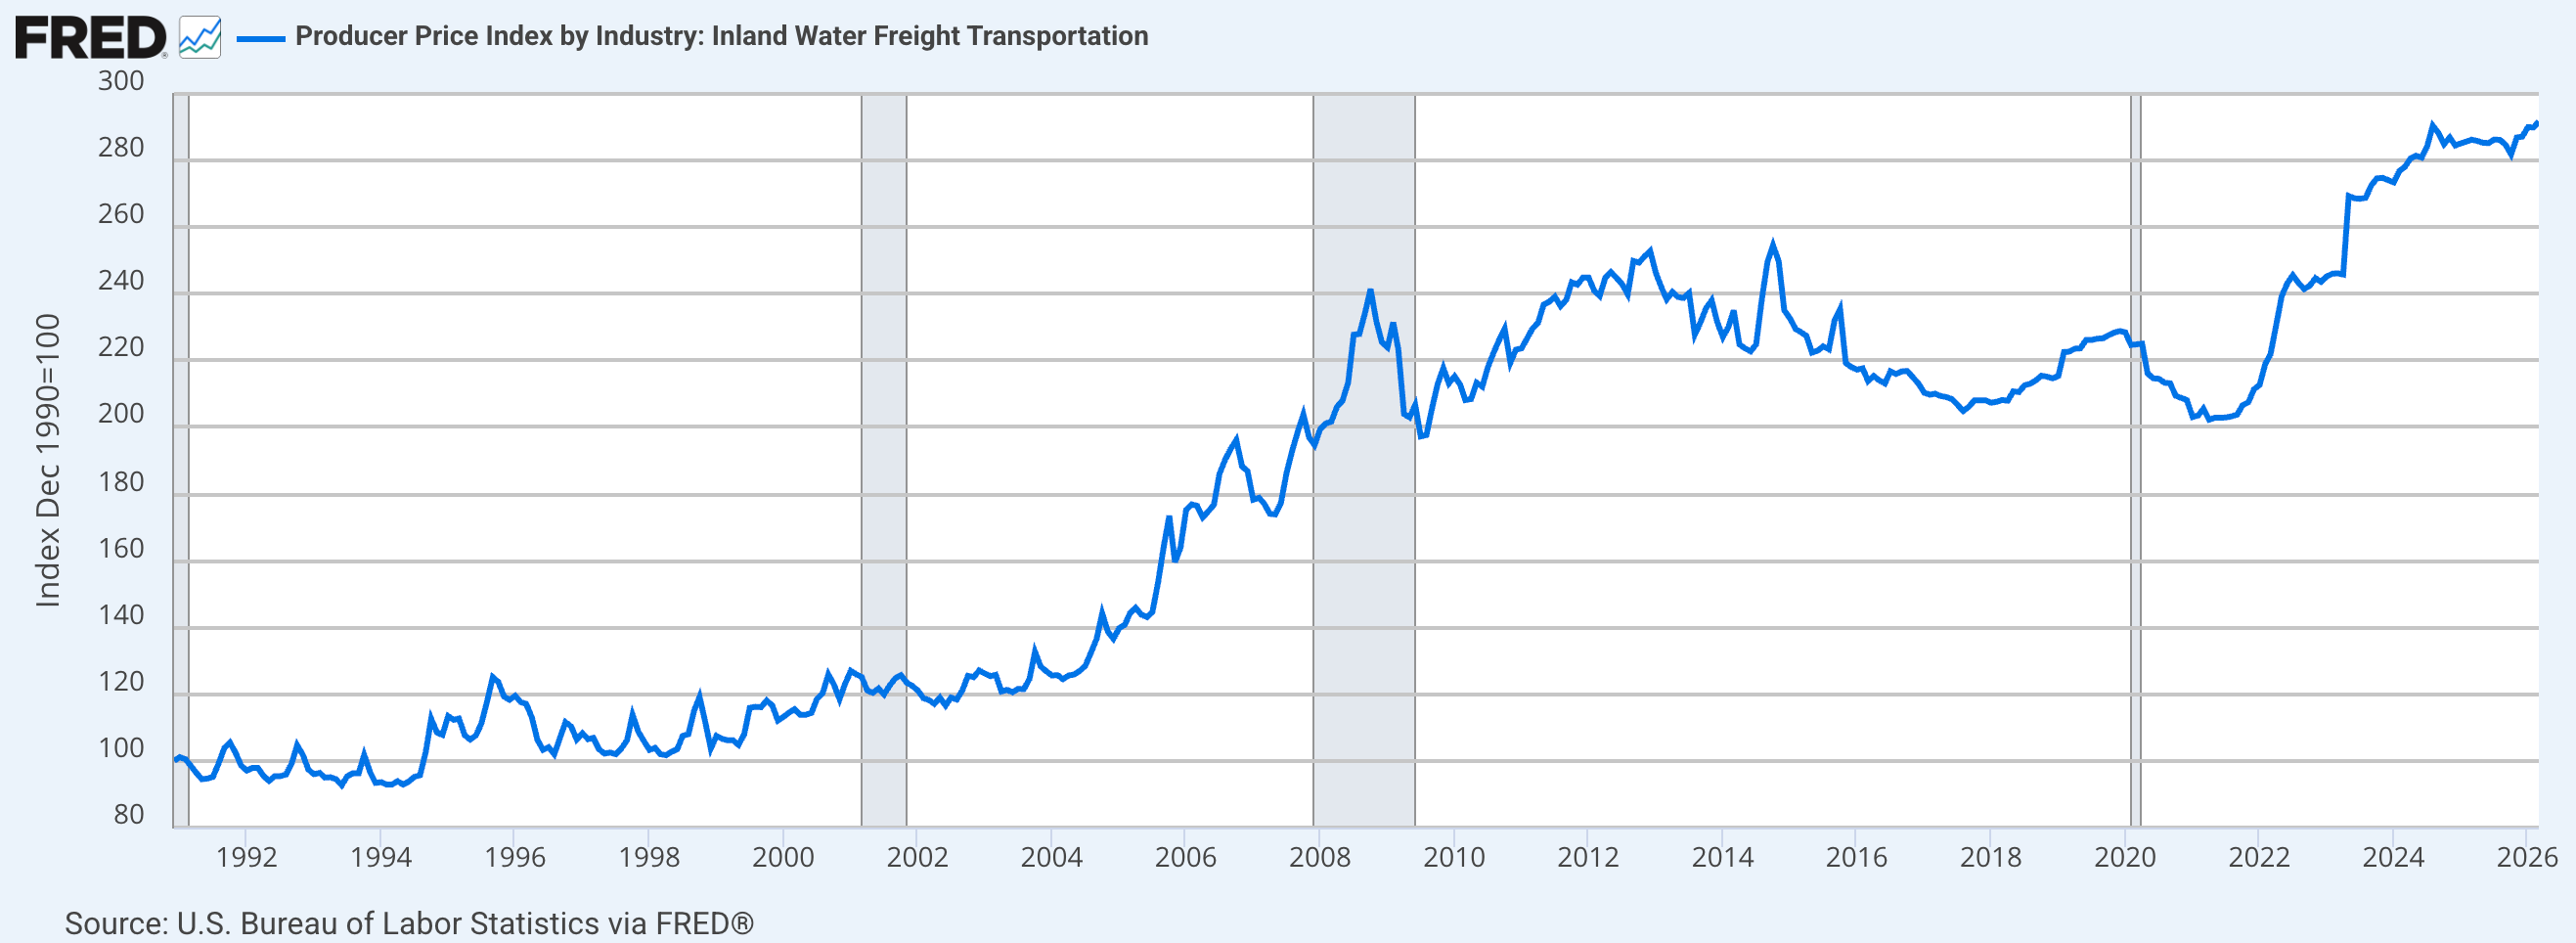
The chart shows the spike. The PPI series, which tracks contract and survey-based prices rather than spot rates, understates the true violence of the spot market during October 2022. The actual disruption in the spot market was roughly four times larger than the index movement. What the chart does show accurately is the speed of the dislocation and the subsequent reversion: the index jumped sharply, then returned toward its structural baseline once water levels recovered. For smaller producers without pre-positioned inventory, the speed of that spike, arriving faster than they could build alternative supply, was precisely what made it damaging.
For grain traders, fertilizer shippers, and smaller cement producers with thin inventories and no alternative logistics, this was a operational crisis. Contracts got missed. Customers went unserved.
In Festus, Missouri, the silos were full.
Why Buzzi was positioned differently
Buzzi’s advantage isn’t about making lucky decisions; it’s built into the network. Festus can fill a 1,750-ton barge in under two hours. When river levels are high, usually from late winter to early summer, freight rates are at their lowest. This is when Buzzi moves cement downstream to build up inventory before river conditions become unpredictable in the autumn.
The Memphis terminal is the main buffer for the south. By filling its 5,000-ton silo when shipping is cheap, Buzzi avoids the massive price spikes caused by seasonal droughts. By the time spot rates hit 400% of normal in October, the product is already in place. You’ve already paid the freight at a much lower rate.
The Cincinnati terminal does the same for the east, while Rock Island adds rail redundancy. Because it’s connected to major rail lines (Union Pacific and BNSF), Rock Island can take cement from inland plants if the river becomes unnavigable. The transport method changes, but the service to the customer stays the same.
This setup isn't just for droughts. It’s for general resilience. The Army Corps of Engineers has warned about aging locks on the Mississippi that could fail within the next twenty years. A network with rail options at key nodes can handle infrastructure failures or flooding much better than a competitor that relies only on the river or trucks.
Market impact and performance during stress
The main takeaway from the 2022 drought that most reports overlooked is that the crisis actually made Buzzi’s position stronger. It didn’t weaken them.
The disruption hit the companies that were least prepared. If you didn’t have inventory already in place, storage at your terminals, or rail backups, you couldn't handle the emergency freight costs without hurting your customer relationships.
The smaller regional distributors, the single-plant operators without terminal networks, the importers who depended on consistent barge availability to maintain just-in-time inventory positions: these are the participants who struggled most visibly. Some of them lost customer relationships they did not recover. The market share they ceded moved to suppliers who could still deliver. Buzzi, in most cases, was one of those suppliers.
There’s a common pattern in industrial sectors: the best test of a business isn't how it does when things are easy. It’s how it handles a crisis. Good conditions benefit everyone, but bad conditions show which companies have real resilience and which ones are just lucky.
The Mississippi drought of 2022 was an adverse condition. Buzzi’s response, which was less a response than the activation of a pre-built contingency architecture, is the most empirically concrete evidence available that the moat described in this article is not theoretical. It was tested. It held.
The counterarguments
I have spent this entire article building a case for why the Mississippi position is structurally durable. To be objective, we have to look at the main arguments against this view. They’re worth a look.
The river region is actually underperforming right now. This is true and worth confronting directly. Buzzi’s management commentary in both 2024 and 2025 specifically flagged “ongoing uncertainty in the river region” as the primary driver of volume weakness in the US business. Total US volumes fell 2.2% in 2025, and this region was the biggest contributor. You might wonder: if the business is so well-positioned, why is demand so soft right there?
The answer requires separating the moat from the market. The moat describes the competitive structure: Buzzi’s cost position relative to rivals, its ability to retain customers others cannot serve, its capacity to weather disruptions that damage weaker operators. The market describes the absolute level of construction activity in a given geography and period. A strong moat does not immunize a business against a demand cycle. It immunizes the business against losing share to competitors during that cycle. The river region has faced a pullback in residential and light commercial construction driven by high interest rates and constrained credit. The advantage means Buzzi keeps its share during a downturn; it doesn't stop the downturn from happening.
The right question to ask isn't why the region is weak, but whether Buzzi is losing market share. Look at the margins. They reported a 36.4% EBITDA margin in 2025, even with lower volumes. If that margin were falling toward 25%, the structural argument would be in trouble. At 36.4%, the business is clearly holding its ground while waiting for the cycle to turn.
The currency risk. Buzzi reports in euros. It’s American business earns in dollars. This means the margins don't always show the whole story. In 2025, the Euro gained value against the Dollar, which led to a negative impact of €71 million on sales and €26 million on EBITDA from the US segment. Since about 52% of their EBITDA is in Dollars, there’s always going to be reporting risk. When the Dollar is weak, the US earnings shrink when converted to Euros, no matter how well the plants are running.
This is a real risk. It’s also a risk that every European company with significant dollar revenues carries, and it‘s not a risk that can be mitigated through operational management. The counterpoint is that it’s symmetric: when the dollar strengthens, the same mechanism amplifies reported results, as it did in 2021 and 2022. Over a full currency cycle, the translation effect nets out. What doesn’t net out is the underlying dollar-denominated economics of the Mississippi position, which remain structurally superior to Buzzi’s European operations regardless of where the exchange rate sits on any given quarter.
Manufacturing cycle and demand risks. The growth in US factory construction is likely already priced in, and it’s not guaranteed to last. While we’ve seen a 300% increase in manufacturing construction over three years, you have to realize this data is backward-looking. The spending from the IRA, the CHIPS Act, and the infrastructure bill is a limited pool of money. It’s a massive injection that won’t be repeated at this scale.
I don’t have high conviction on the duration of the manufacturing construction cycle, and anyone building a valuation model that assumes $240 billion in annual manufacturing construction spending persists indefinitely is extrapolating a three-year spike into a permanent baseline. It’s more realistic to see this as a temporary boost rather than a permanent change in the market. Buzzi’s structural cost advantage stays the same, but the cycle is just the environment they’re operating in, not the core reason for the investment.
Imports through the Gulf Coast represent a long-term competitive threat. Competition from imports through the Gulf Coast is a real long-term risk. While the New Orleans terminal gives Buzzi access to the ocean, it does the same for foreign producers. Companies from Turkey, Vietnam, and China periodically ship cement to the US when local prices are high enough to cover the freight. Current tariffs protect the market for now, but policy can change, and since there’s plenty of global supply, imports could become more competitive over time.
You have to look at this as a threat to Buzzi’s pricing power in the Gulf Coast markets. However, it’s much harder for imports to reach the core markets in Missouri or Illinois. Moving cement 1,500 miles upstream from the Gulf is too expensive, regardless of tariffs. The competitive advantage is strongest in the interior and weakest at the port.
What to watch, and why it matters
I want to close with a broader point about the demand environment that the Mississippi corridor serves, and then the specific signals worth monitoring going forward.
The American cement market is commonly associated with residential construction, the housing cycle, interest rates, mortgage demand. That association is misleading for Buzzi specifically. Its Midwest and Gulf Coast footprint is more exposed to infrastructure and industrial construction than to housing starts, and those two demand categories have been diverging sharply.
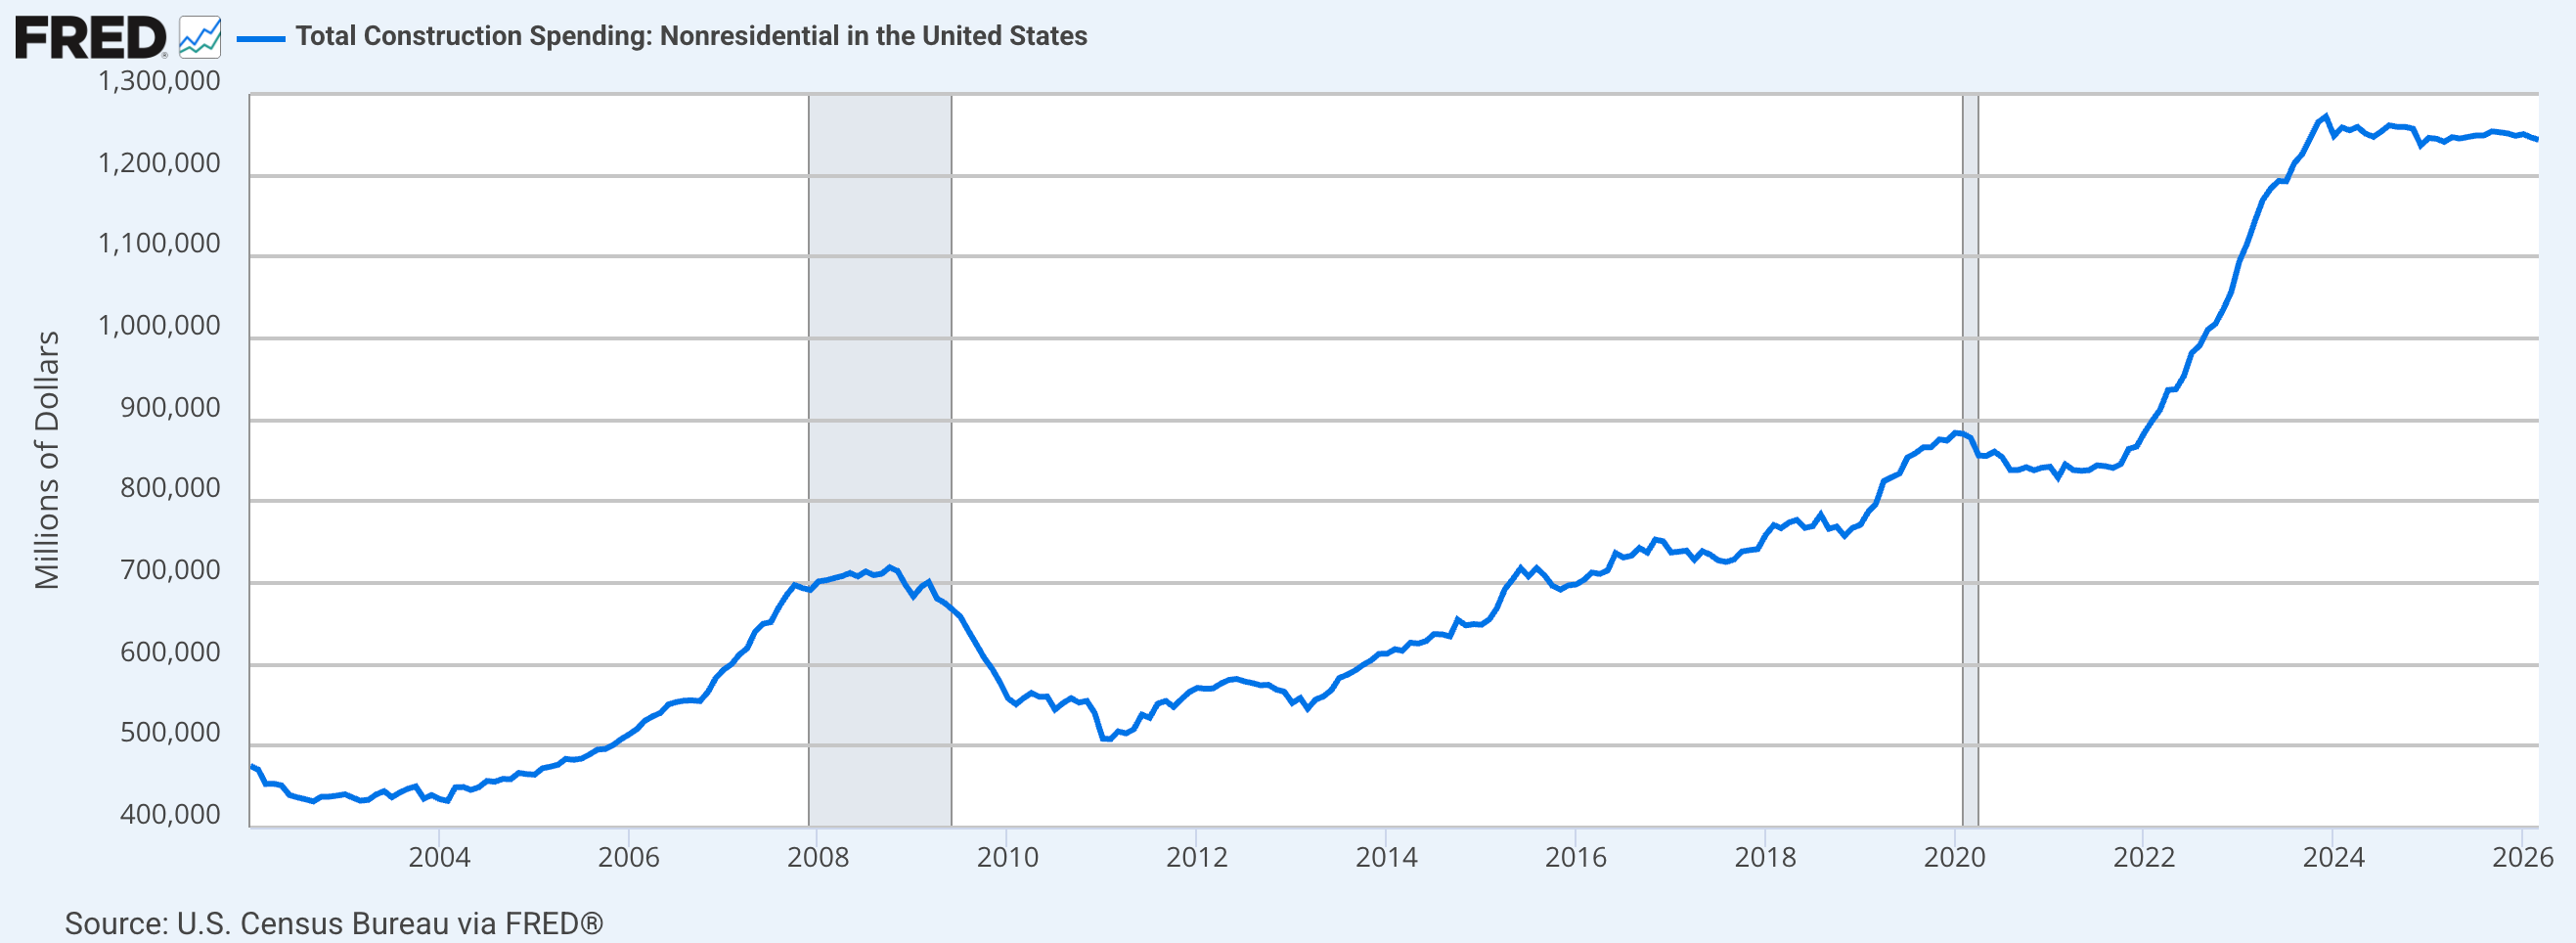
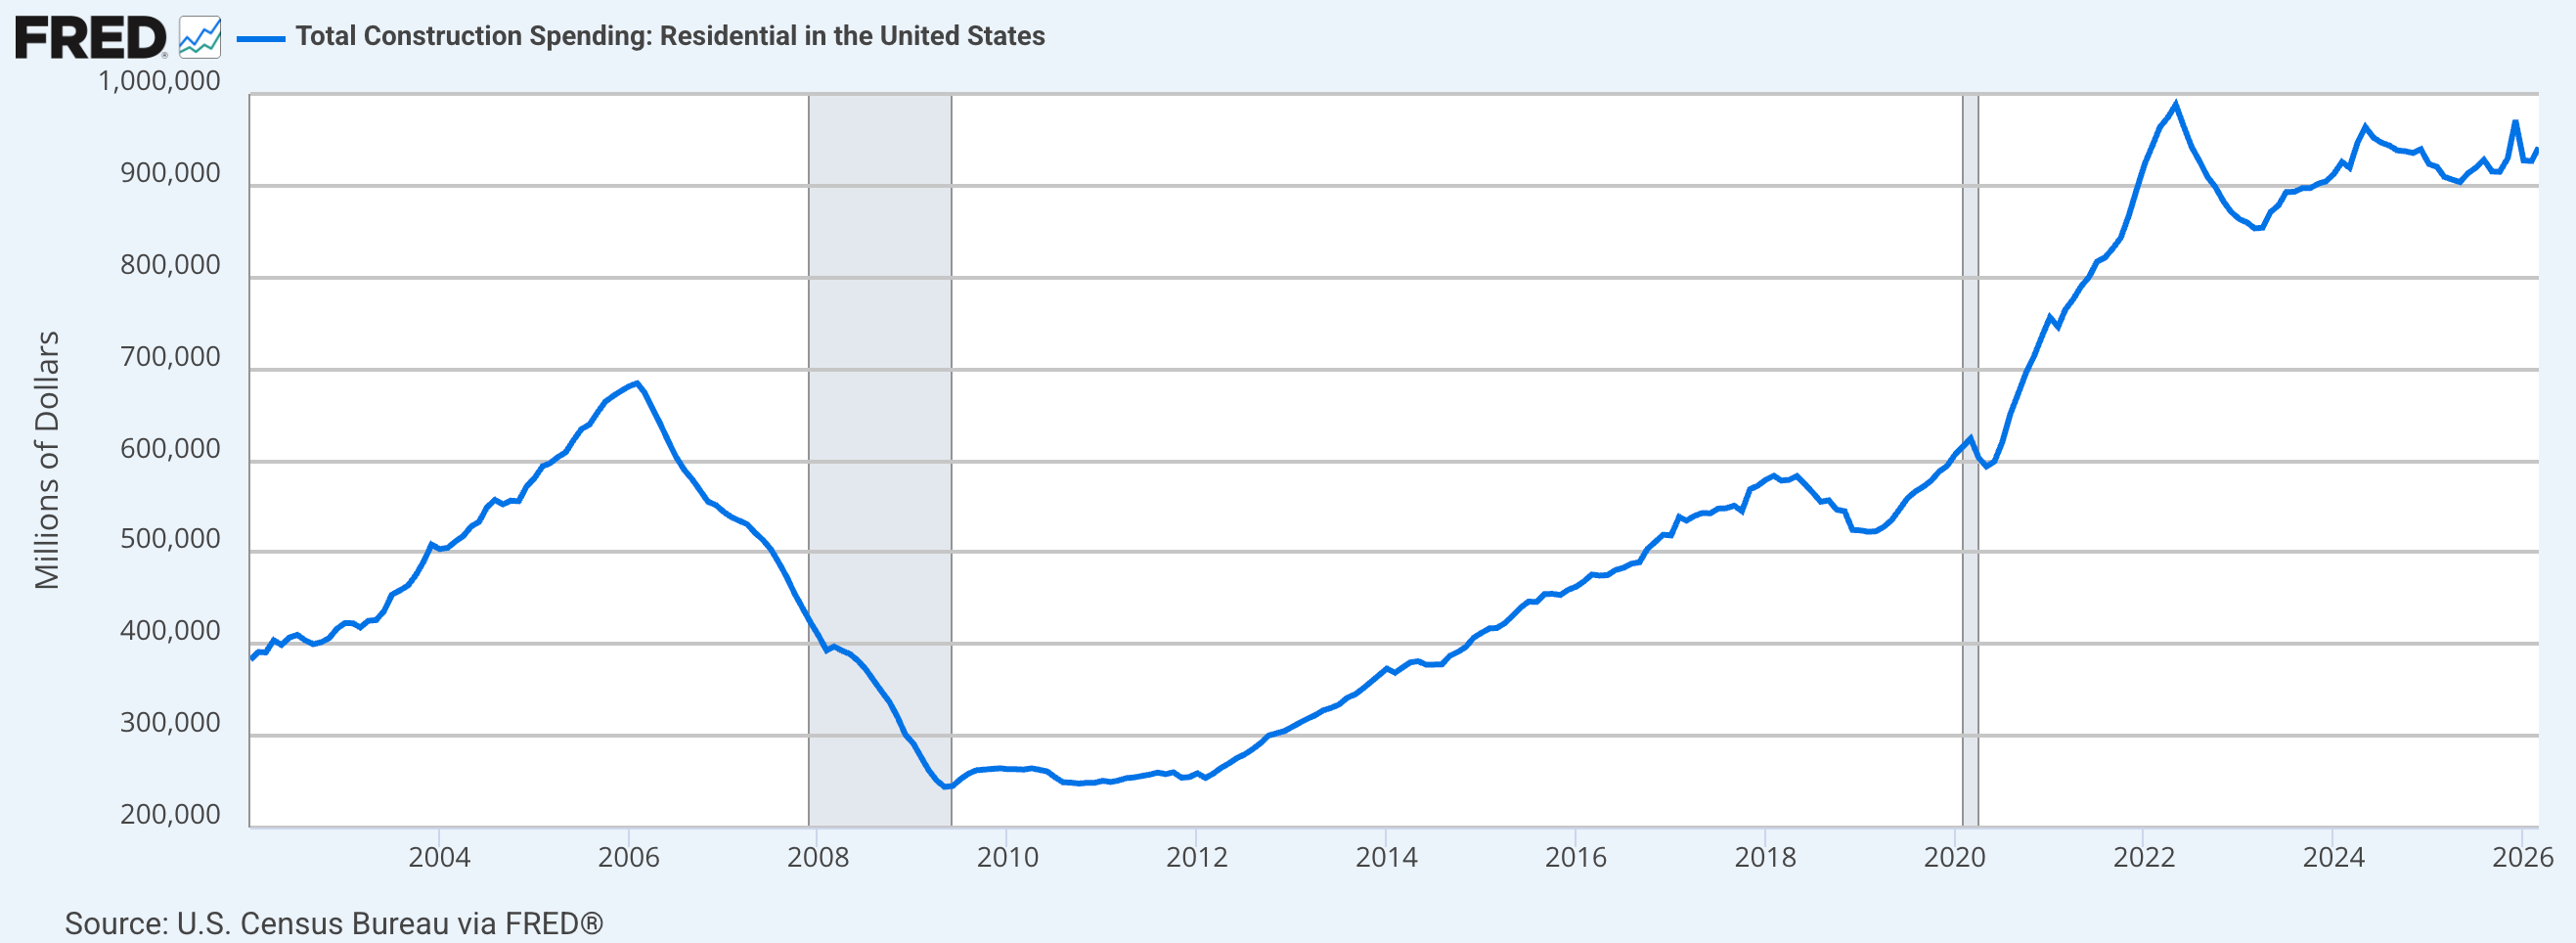
Within non-residential, the most dramatic movement has been in manufacturing construction specifically, driven by the wave of domestic industrial investment triggered by the Inflation Reduction Act, the CHIPS Act, and the reshoring of semiconductor, battery, and pharmaceutical production that began in earnest after 2022.
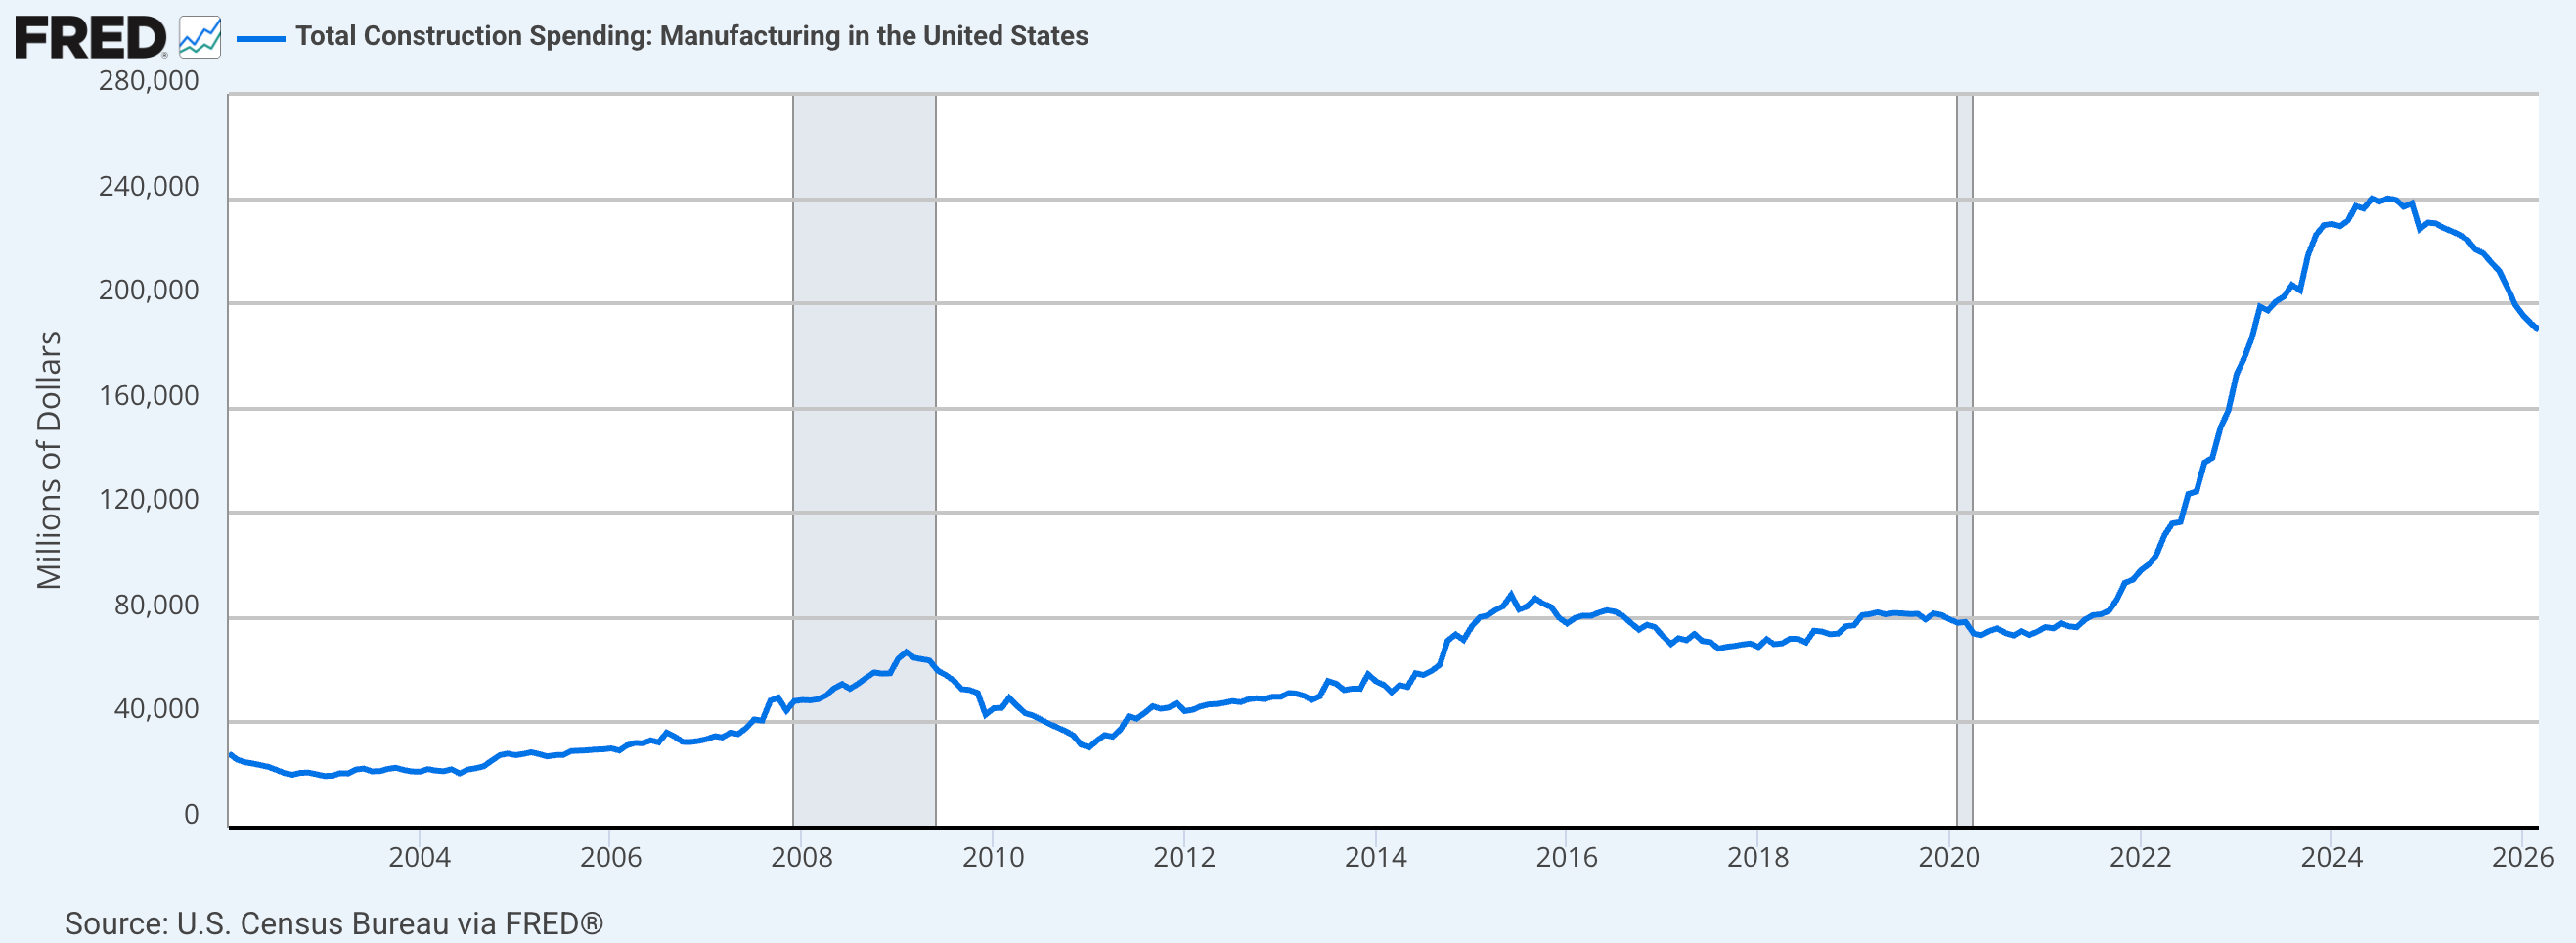
Manufacturing construction spending was roughly flat at $60 to $80 billion annually for most of the 2010s. By 2024 it had surpassed $240 billion, a more than 300% increase in three years. A substantial share of that industrial buildout is happening in the Midwest and Gulf Coast states, precisely the geography that Buzzi’s river network covers. The factories, data centers, battery plants, and semiconductor fabs being built in Missouri, Tennessee, Kentucky, Arkansas, and Texas are consuming cement. And they are consuming it within the distribution radius of Buzzi’s terminal network.
This is the structural demand context behind the margin performance described at the opening of this article. The river position is not just defensively strong. It runs directly through the geography where American industrial construction is growing fastest.
Three categories of signals are worth tracking as you follow Buzzi going forward.
Capital allocation into the network. The best way to see if Buzzi still believes in the river's value is to check their capital spending. Look for investments in limestone reserves, terminal upgrades, or grinding capacity along the Mississippi. This is the company "voting" with its cash. If you see them redirecting capital toward assets that aren't connected to the river network, you should investigate why.
River vs. Texas performance. Management usually separates the river region from their Texas operations in their reports. Texas is a solid business, but it doesn't have the same logistics edge. When volumes on the river drop but margins stay high, it shows the structural advantage is working. However, if volumes fall and margins compress significantly below 33%, you have to ask if the problem is more than just a temporary market cycle.
The US EBITDA margin through the cycle. Historically, US margins have stayed between roughly 31% and 38%. Even with the 2025 headwinds, they hit 36.4%. As long as margins stay above that 31%-33% floor during a downturn, the transport and cost advantages described here are still doing their work. If they drop below that, the thesis is under pressure.
The Big Picture
The broader point I want to leave you with is this. Most competitive advantages in this industry are temporary or depend on a specific management team. This position is different because it isn't based on management skill, it’s based on geology, physics, and regulation.
This is what a real competitive edge looks like in heavy industry. It isn't a patent that will expire or a technology that will be replaced by the next generation of engineers. It’s a physical system that combines geography with the patience to build around it over decades. That’s much harder for a competitor to disrupt than just spending capital.
That’s the core of the Buzzi thesis. It’s a network built on physical facts that don't change with the cycle. If you keep an eye on the US margins and capital spend, you’ll see how it holds up. Thanks for reading. I’d love to hear your take.
Disclosure: I hold a long position in Buzzi SpA. Nothing in this article constitutes investment advice. This is analytical and educational content. The reader is responsible for their own investment decisions.